Scanning with Confidence
A hands-free redesign for field inspectors.
A hands-free redesign for field inspectors.
Inspectors on site could not tell which direction they had already scanned. The interface gave them no visual guidance, so they relied on trial and error, and confusing start, pause, and stop indicators made it worse.
We reframed the scan volume from a hard-to-read 3D cube into a flat 2D grid, added two clear scanning patterns, and moved control to hardware buttons so inspectors could work with both hands on the scanner instead of on a screen.
Inspectors could see exactly where a scan had covered, in real time, without touching the tablet. The redesign reduced the guesswork that used to come from repeated trial and error passes.
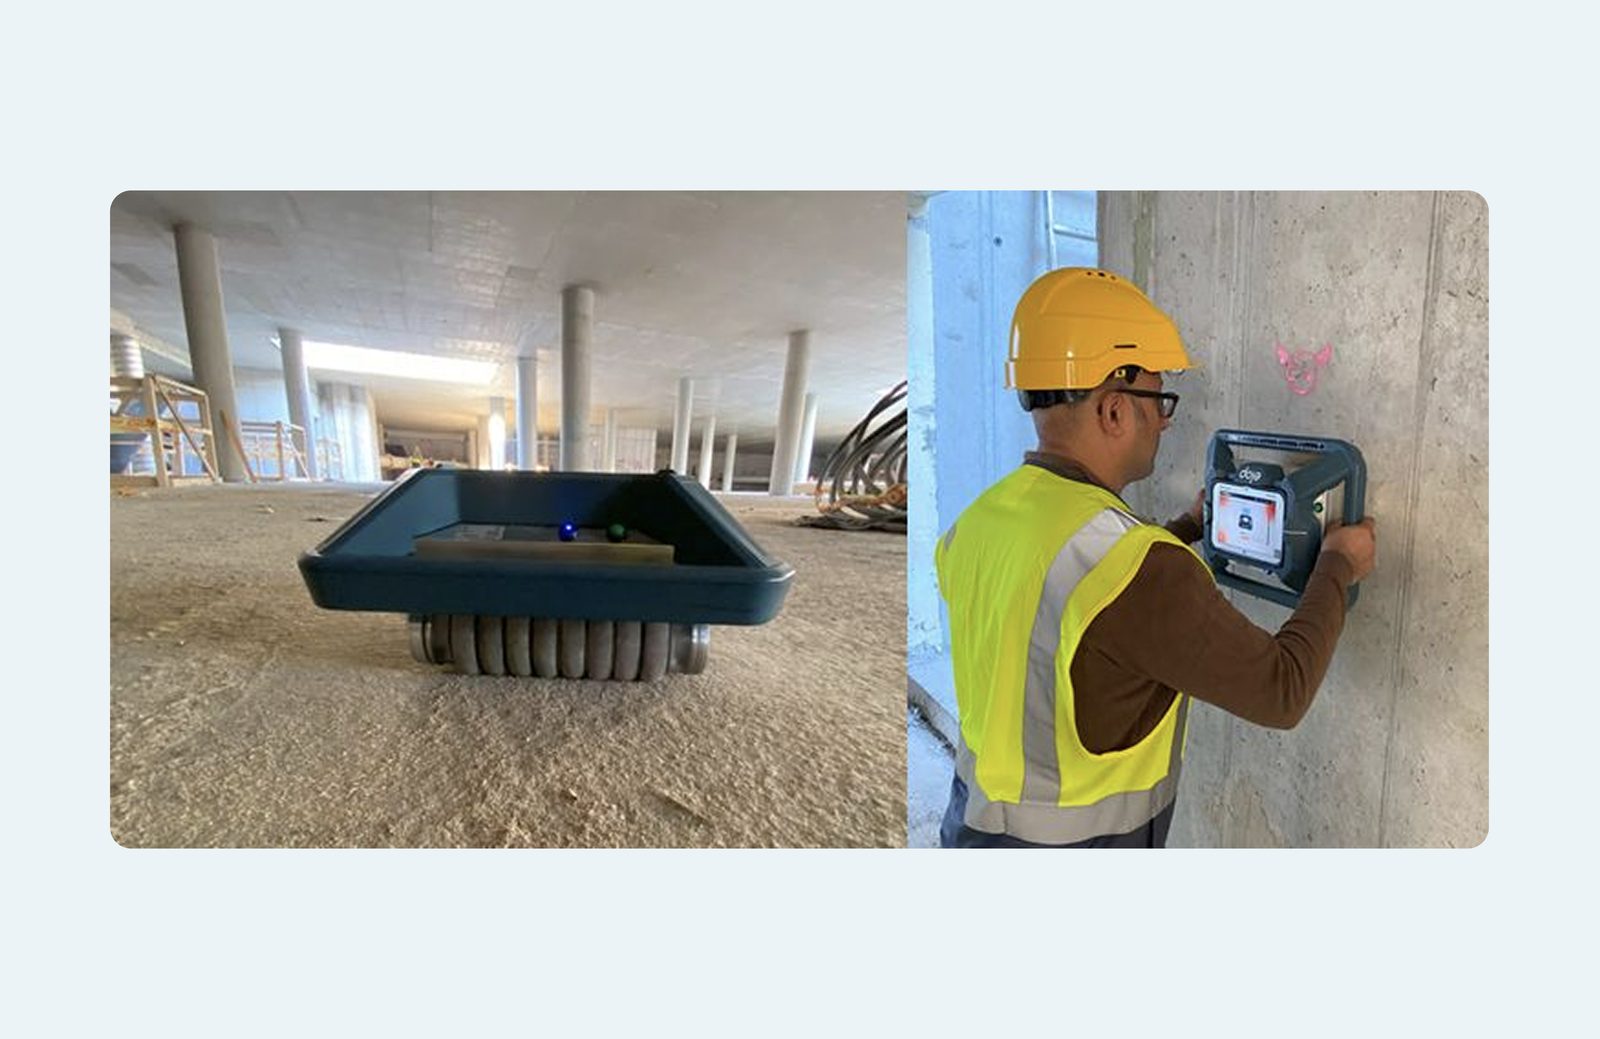
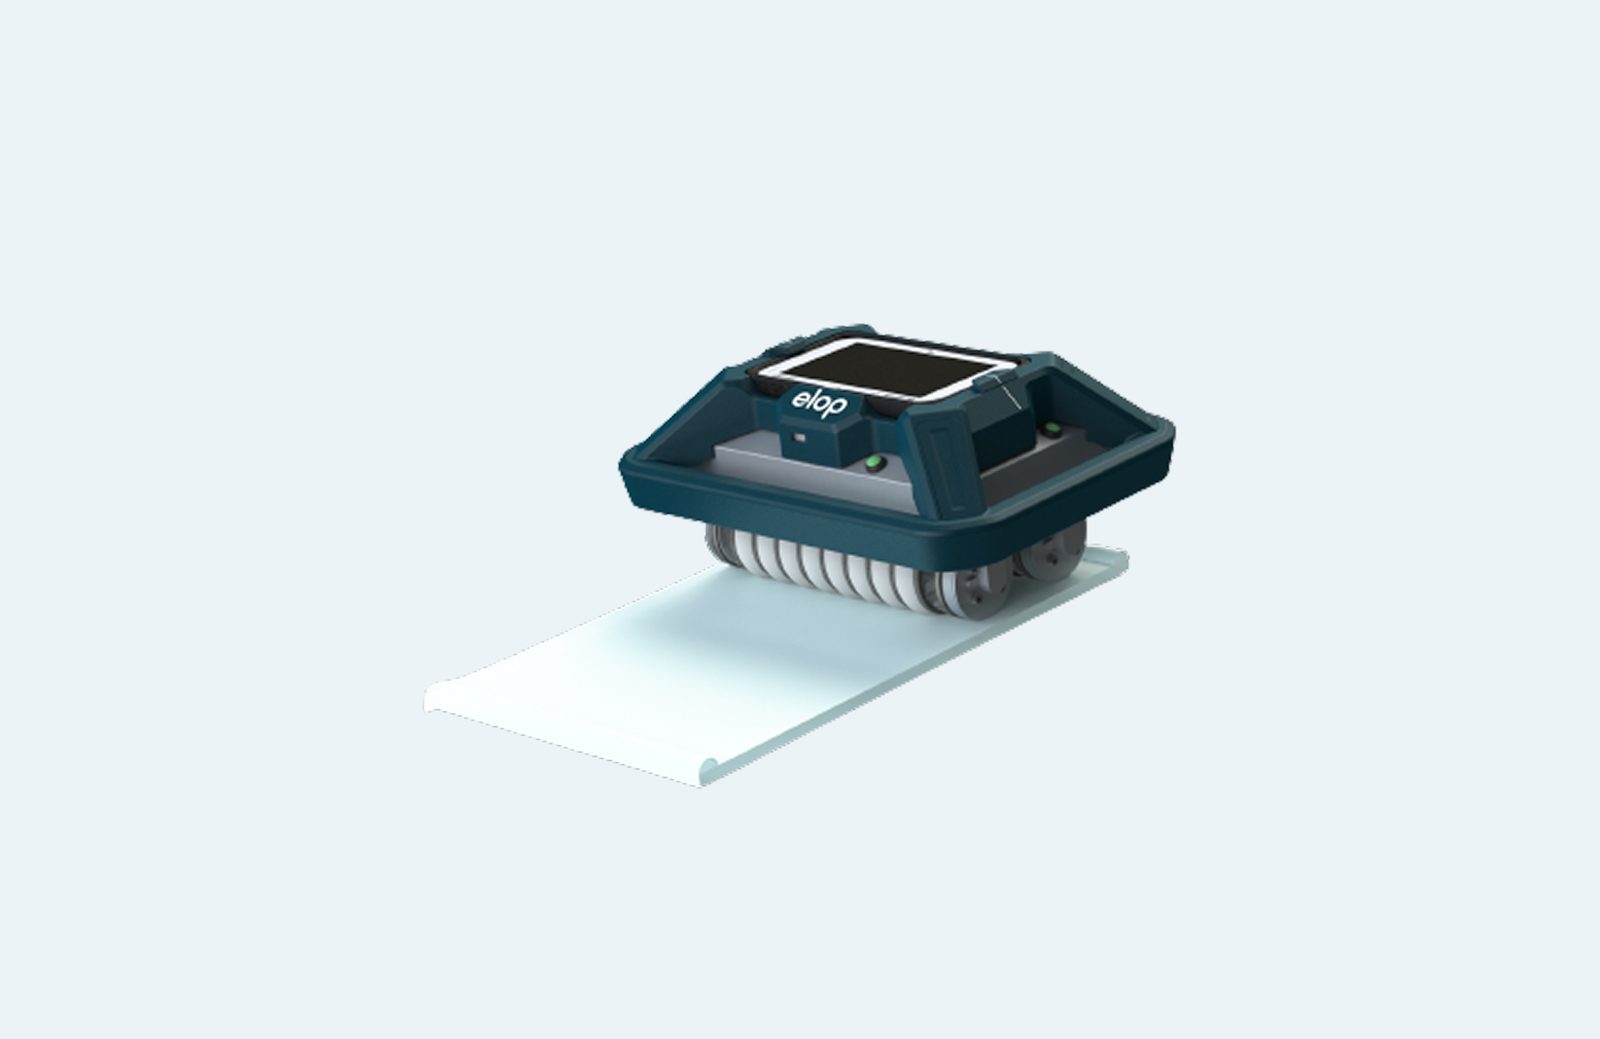
The Elop scanner is the world's first rolling ultrasonic scanning solution. NDT inspectors use it to scan concrete surfaces on tunnels, bridges, and other large infrastructure, and the readings form a heat map that reveals cracks, voids, and other signs of structural wear. This case study covers a focused redesign of the scanning experience itself, the moment an inspector presses start and has to trust that the device is capturing the right surface, in the right direction, on the first try.
Inspectors in the field had a hard time visualising the direction of their scans. The interface showed a 3D volume that was difficult to read at a glance, and it gave almost no feedback about what had already been covered.
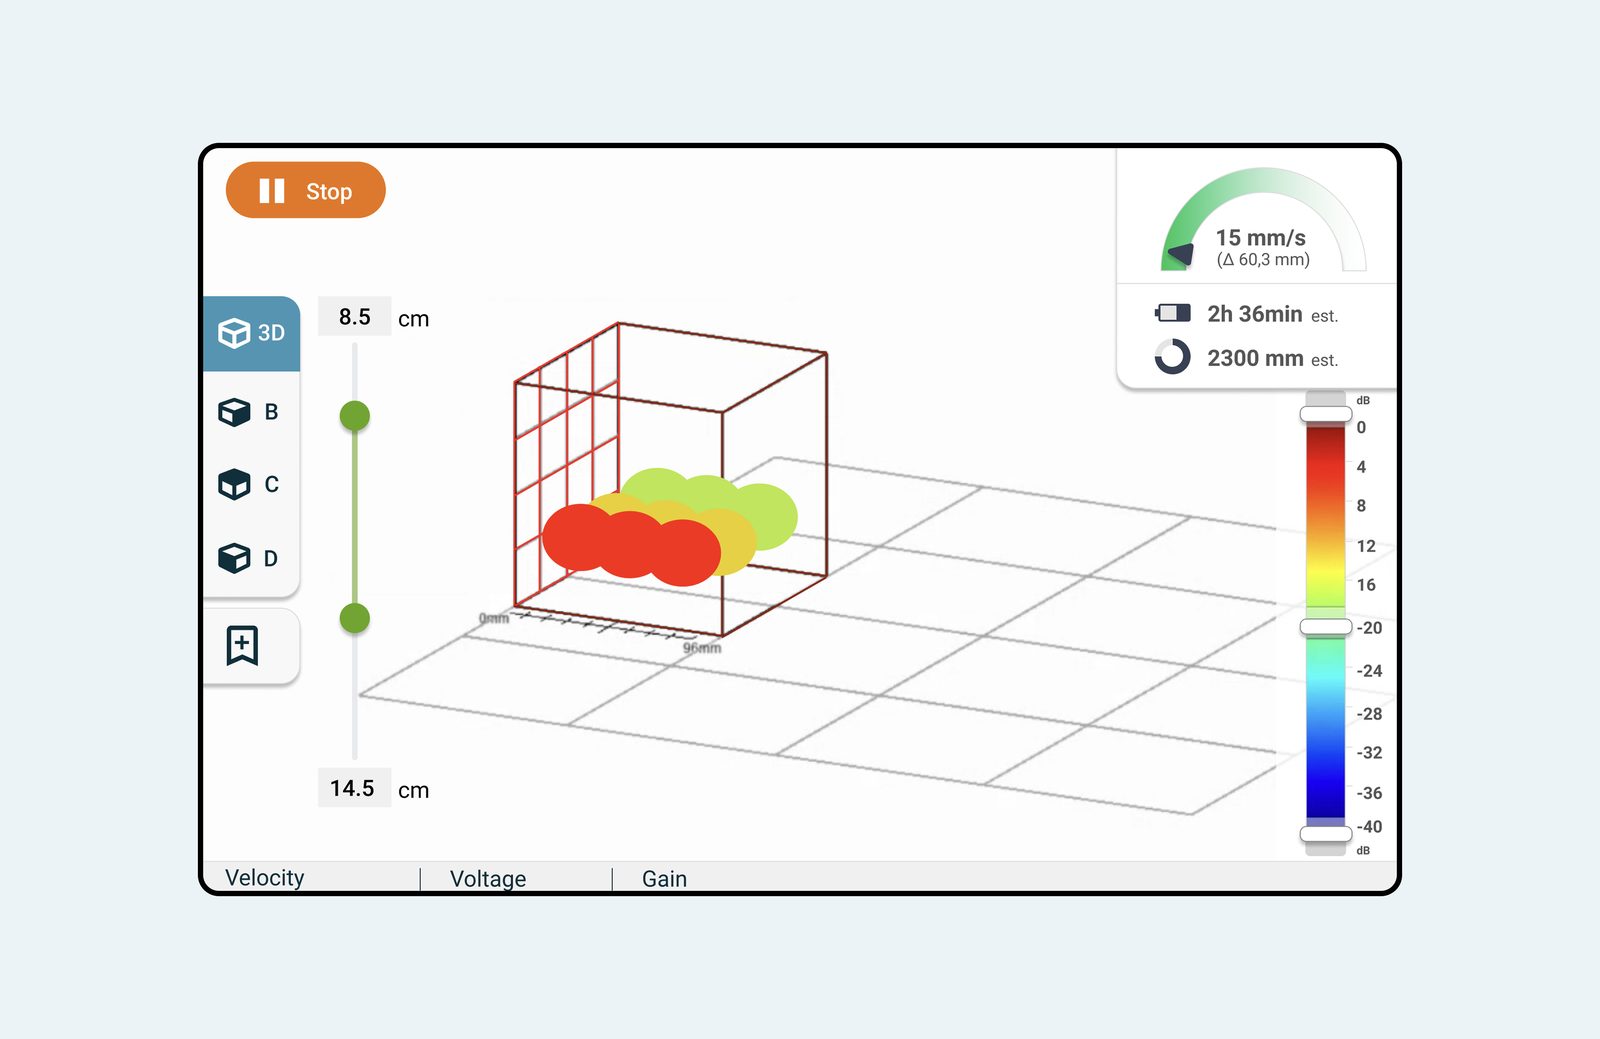
This was not a feature gap. Inspectors could technically operate the scanner, but they could not trust it. Every scan carried a small risk of having to redo the work.
Field research made it clear that this device does not live in a lab. It lives on construction sites, tunnels, and bridge decks, and the interface had to hold up under conditions a typical app never has to consider.
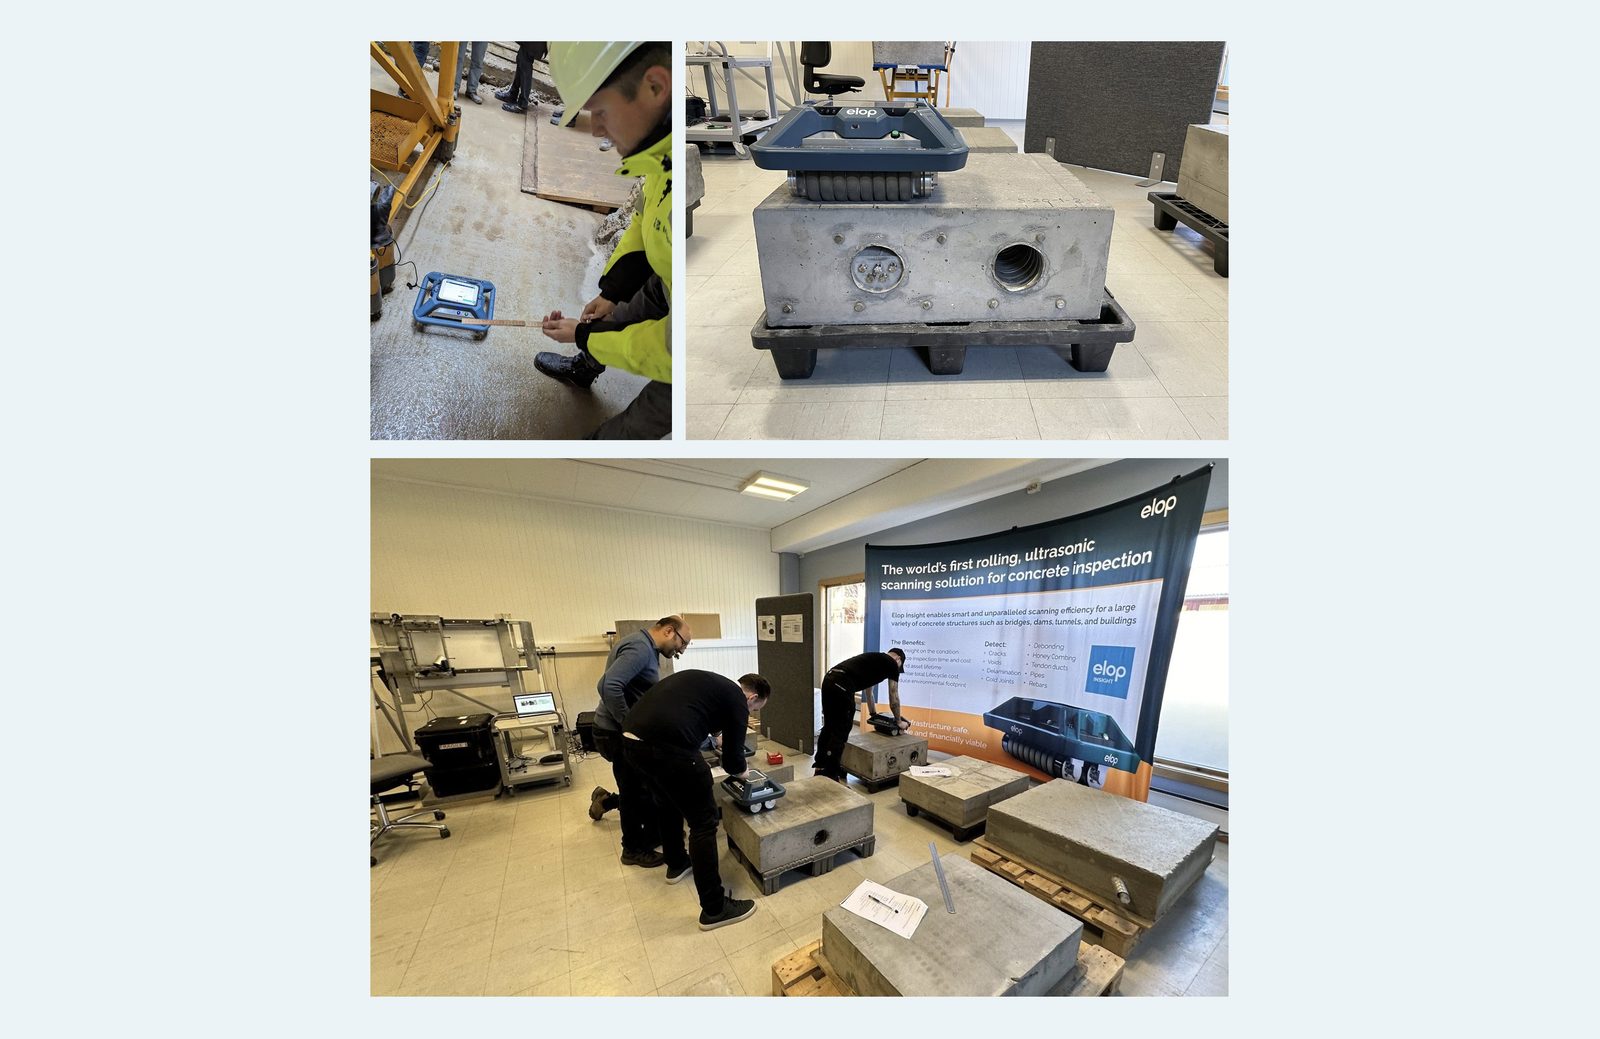
We set four goals to guide the redesign:
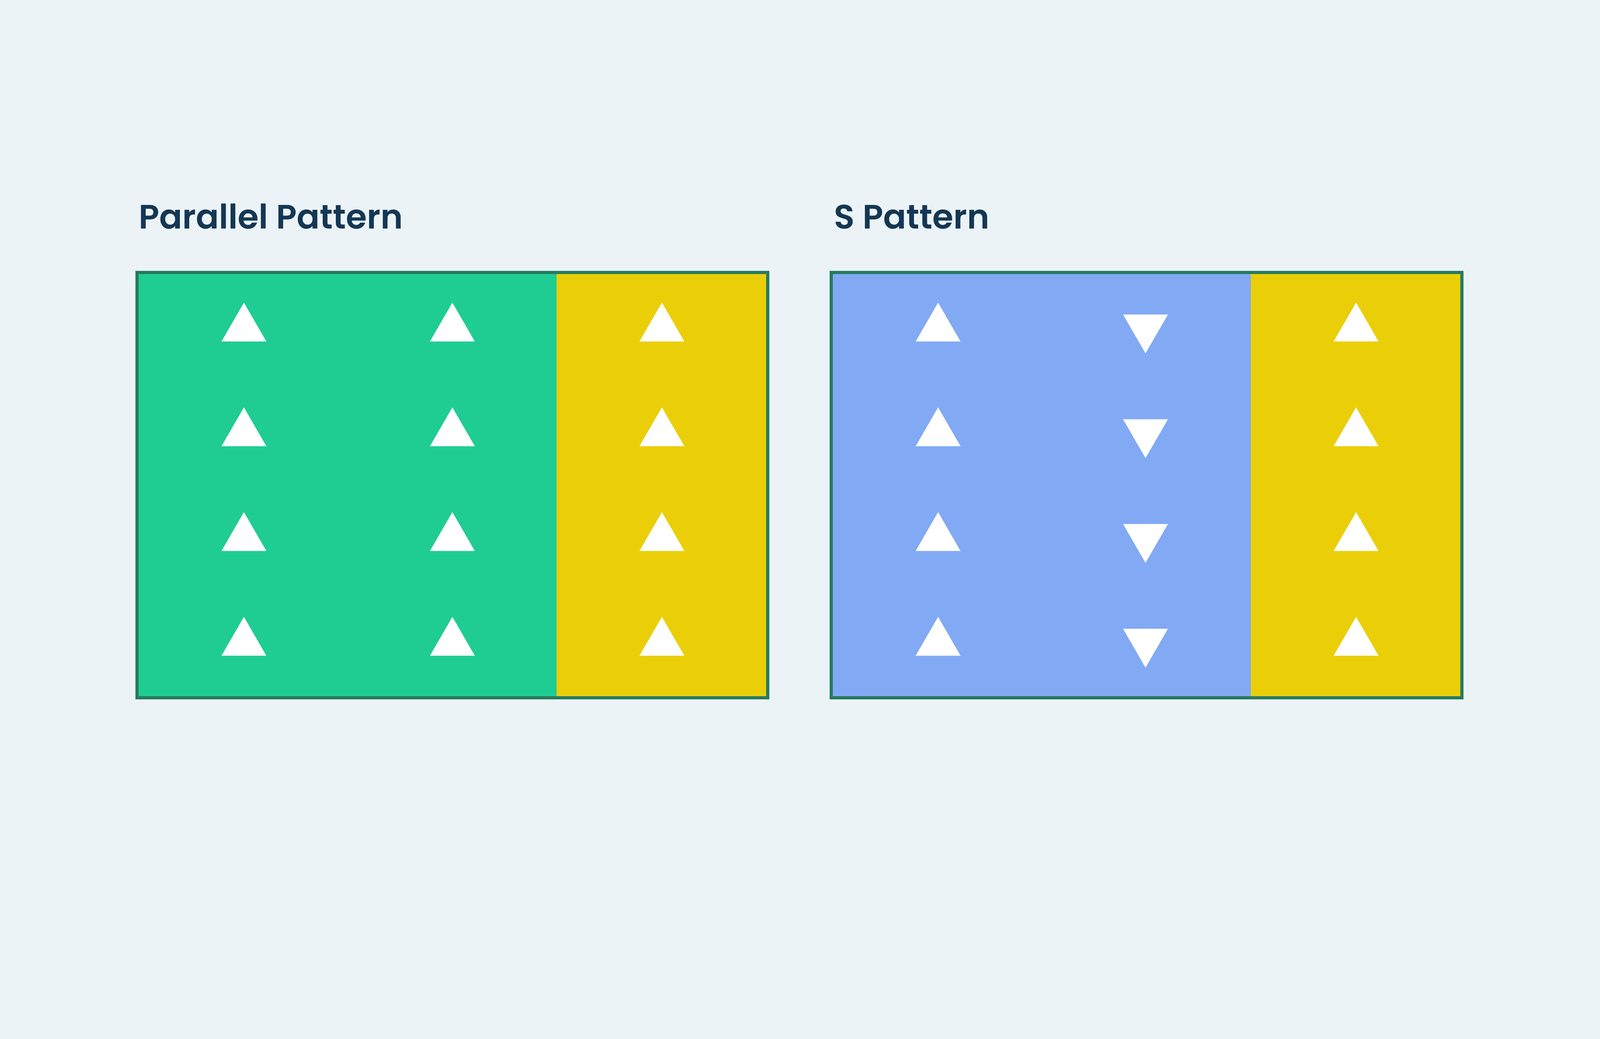
The scanner rolls forward and backward. Once an inspector starts a pass, they are guided to continue in the same direction until that segment is complete, which gives the system a predictable, trackable line to visualise.
Field visits surfaced two natural patterns inspectors already used:
Designing explicitly for both meant the interface could show the right guide for whichever pattern the inspector chose, instead of forcing one workflow on every job.
Borrowing a photographer's instinct, shoot now and edit later, we gave inspectors the option to capture scans without waiting for them to process. This decoupled the physical act of scanning from the network-dependent step of generating a heat map, so a weak connection on site no longer stalled the work.
The tablet mounted on the scanner shows the visualisation, but it is not practical to tap through screens while holding an 8 to 9 kilogram device with both hands. We moved the primary controls to a hardware button, and used the screen purely for visual feedback rather than input.
The redesign concentrated on the new scan flow, from pressing start through capturing tracks to saving and finishing, since this was where inspectors spent most of their time and hit the most friction.
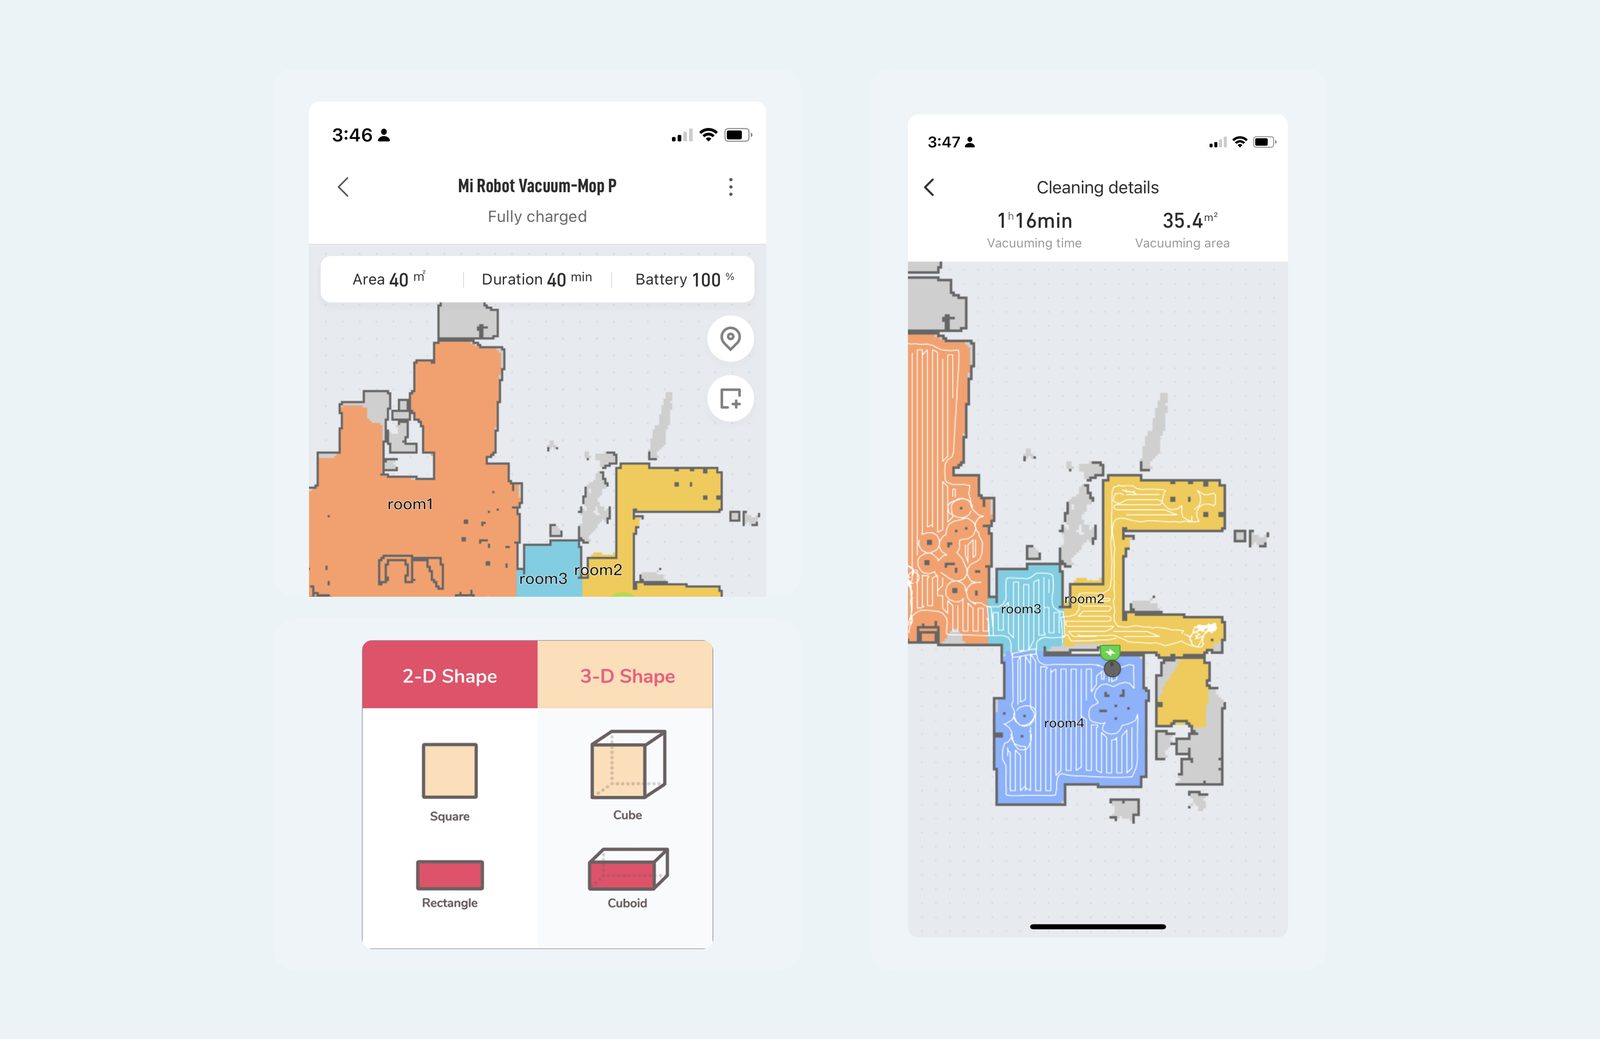
A recently purchased robot vacuum turned out to be a useful reference point. Its app showed pattern settings and a live visualisation of cleaning progress across a floor plan, which mapped closely to what an inspector needed to see while scanning a wall or tunnel section.
The earlier design represented the scan area in 3D space, which made a cube or block genuinely hard to read at a glance. Every surface a scanner actually works on, a wall, a tunnel bore, a bridge deck, is functionally flat. Reframing the scan area as a 2D shape rather than a 3D volume made both the parallel and S patterns much easier to represent, and much easier to understand in the field.
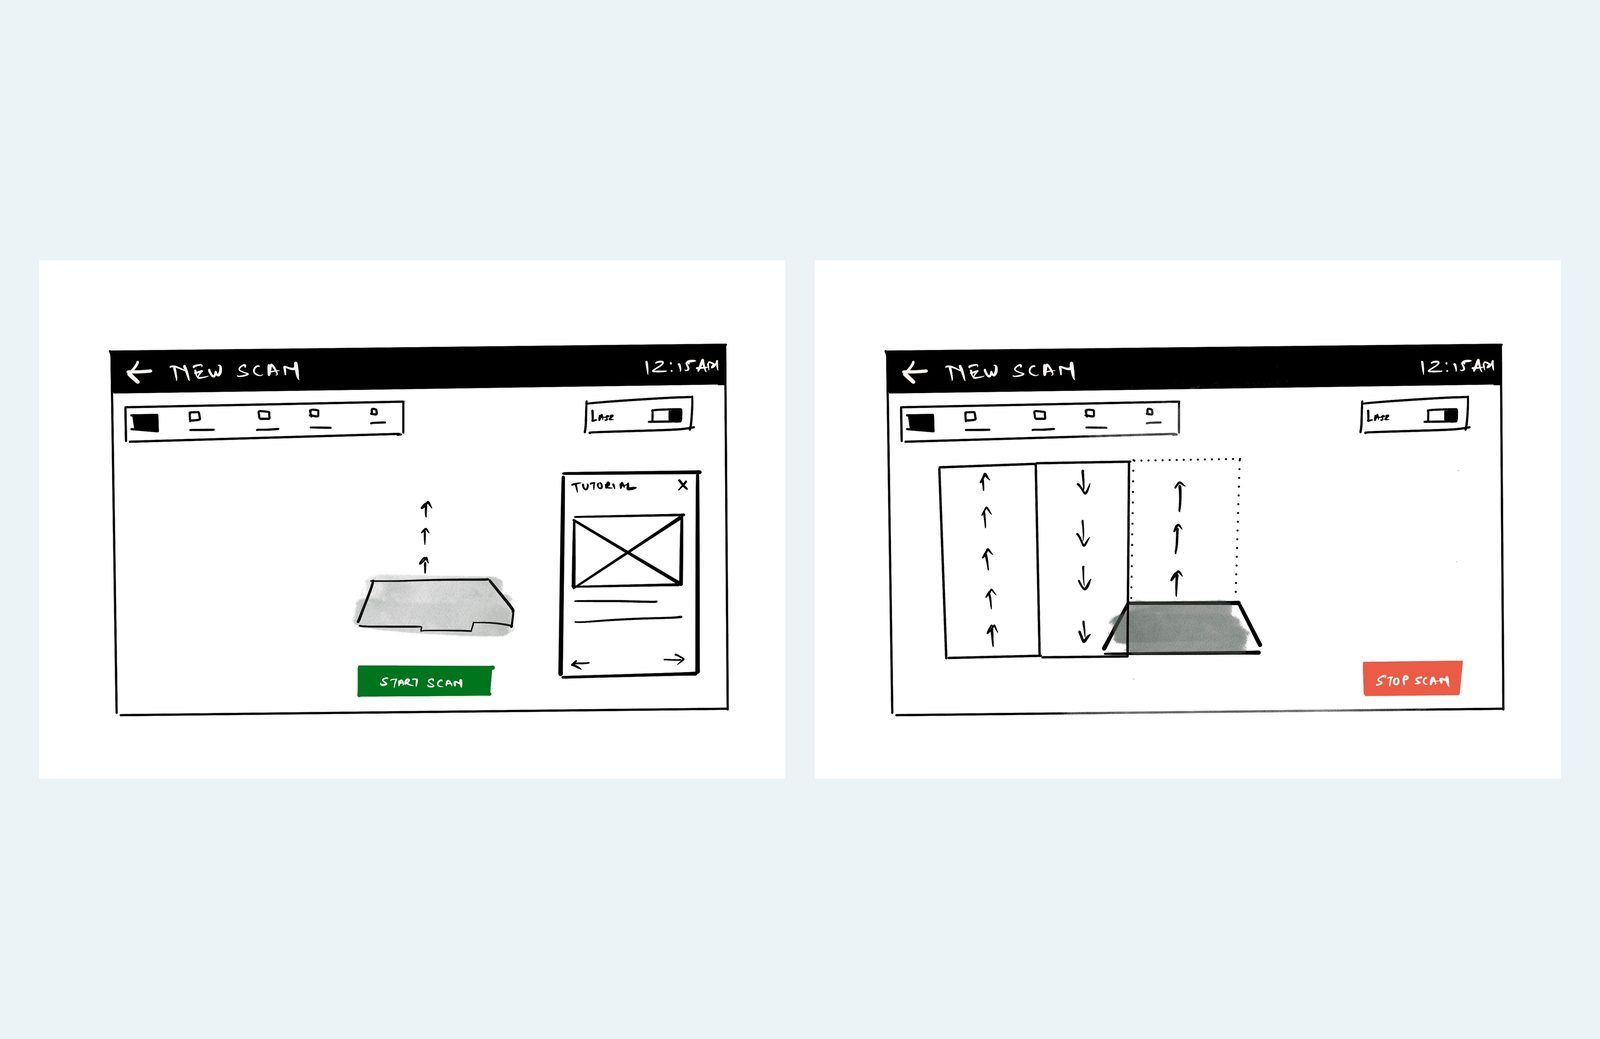
Early wireframes tested the shift from a 3D scan preview to a flat, grid-based capture screen, with directional arrows showing coverage as it happened. This is where the hands-free interaction model and the visual language for tracking scan direction first took shape, ahead of the pattern and status refinements that followed.
Framing the surface as 2D made it far easier to onboard a new inspector. An onboarding guide walks the user through starting a scan entirely by hardware button, without needing to touch the tablet, and the flatter mental model made room for a clearer grid and better scanner navigation.
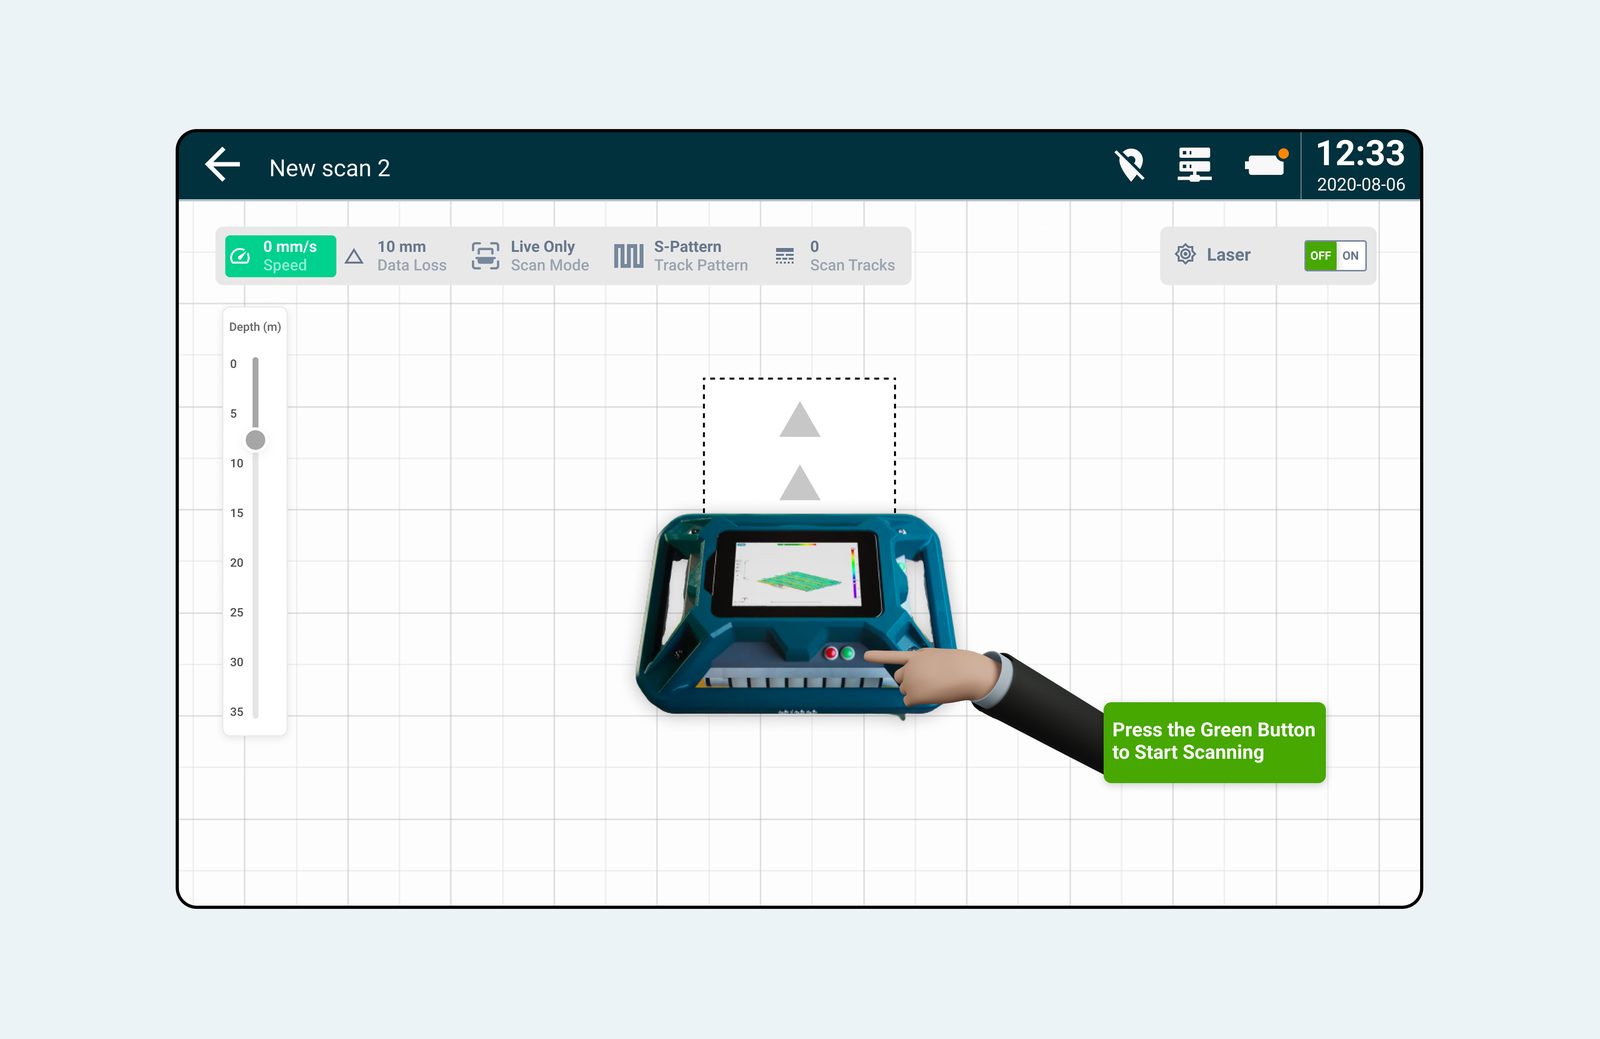
Once a scan starts, the grid lines and the live heat map become the guide. They show the direction and length of the scan as it is captured, along with the number of tracks recorded so far, so the inspector always knows exactly what has been covered.
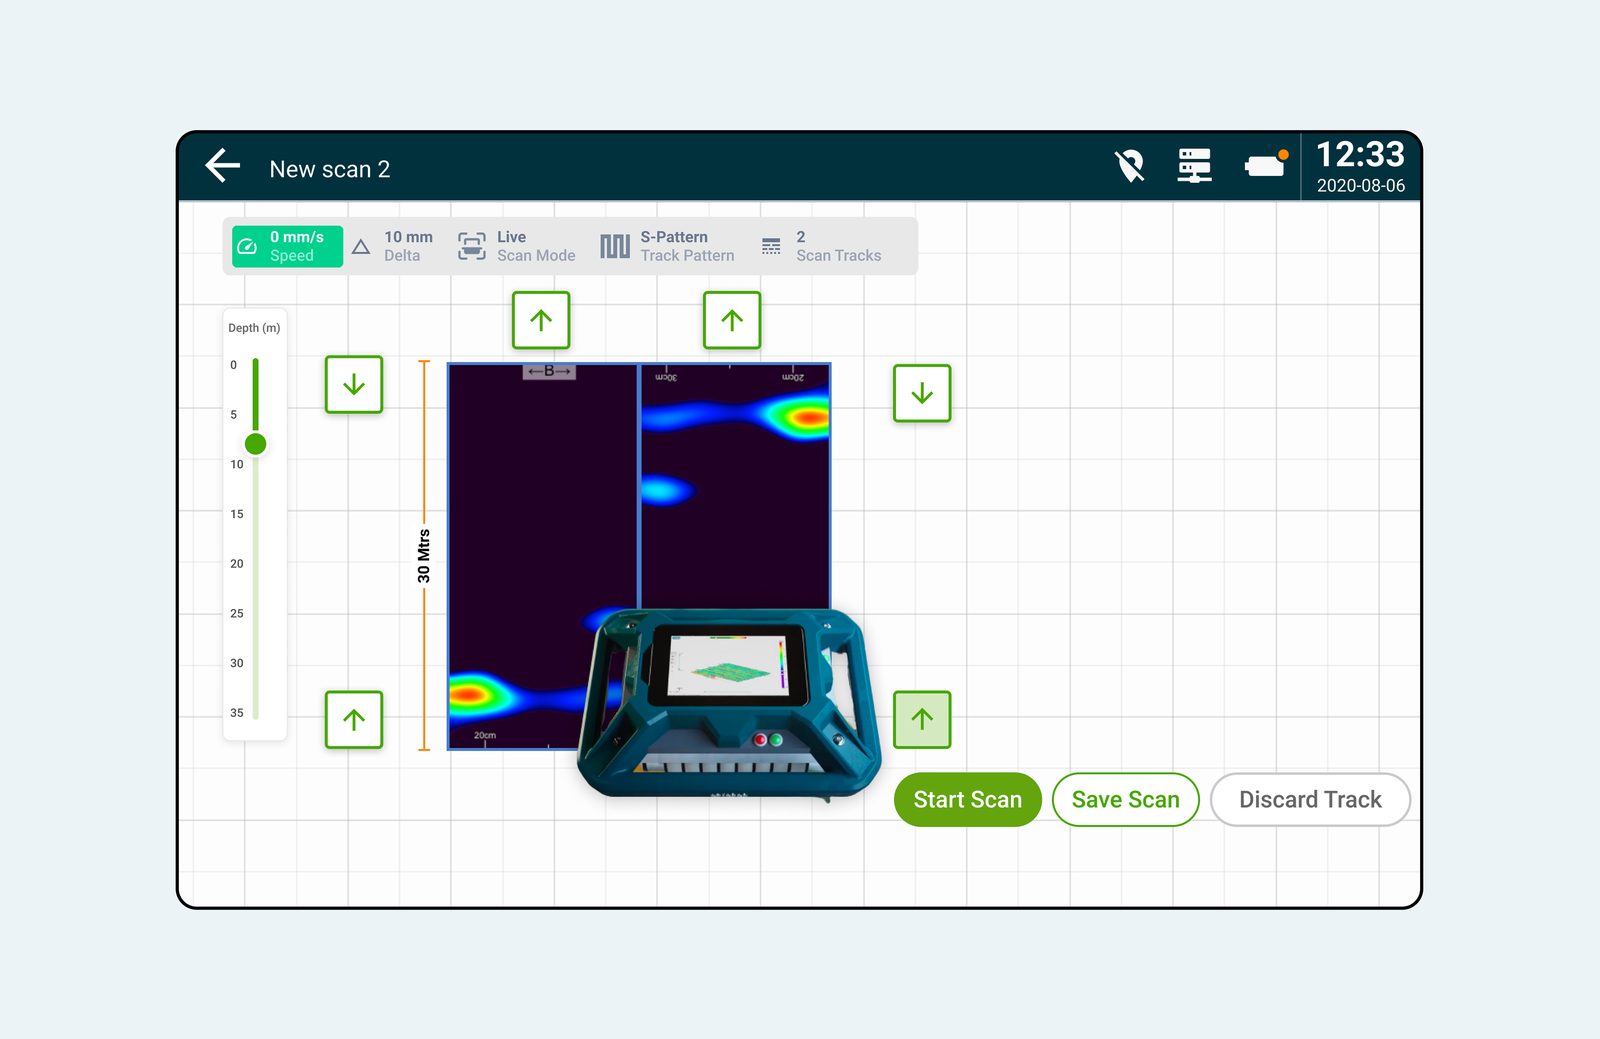
After finishing one track, an inspector can continue scanning in a new direction, switch patterns mid-job, or resume scanning above a track that is already complete. The system surfaces that choice clearly instead of forcing a single fixed path.
Network conditions on site could delay the heat map from loading, which broke the rhythm of scanning. A capture-only mode let inspectors keep scanning with zero lag, generating the heat map in the background once the scan was complete.
Capture-only mode reuses the same grid and track view, with heat map rendering deferred until a connection is available.
Make it easy for users, even if it means changing the entire structure of your app, make it better for the user.
This exercise allowed us to actually step into the shoes of the inspector, experience their day, and their interactions with the device. Our observations helped us design a better user interface for years to come.