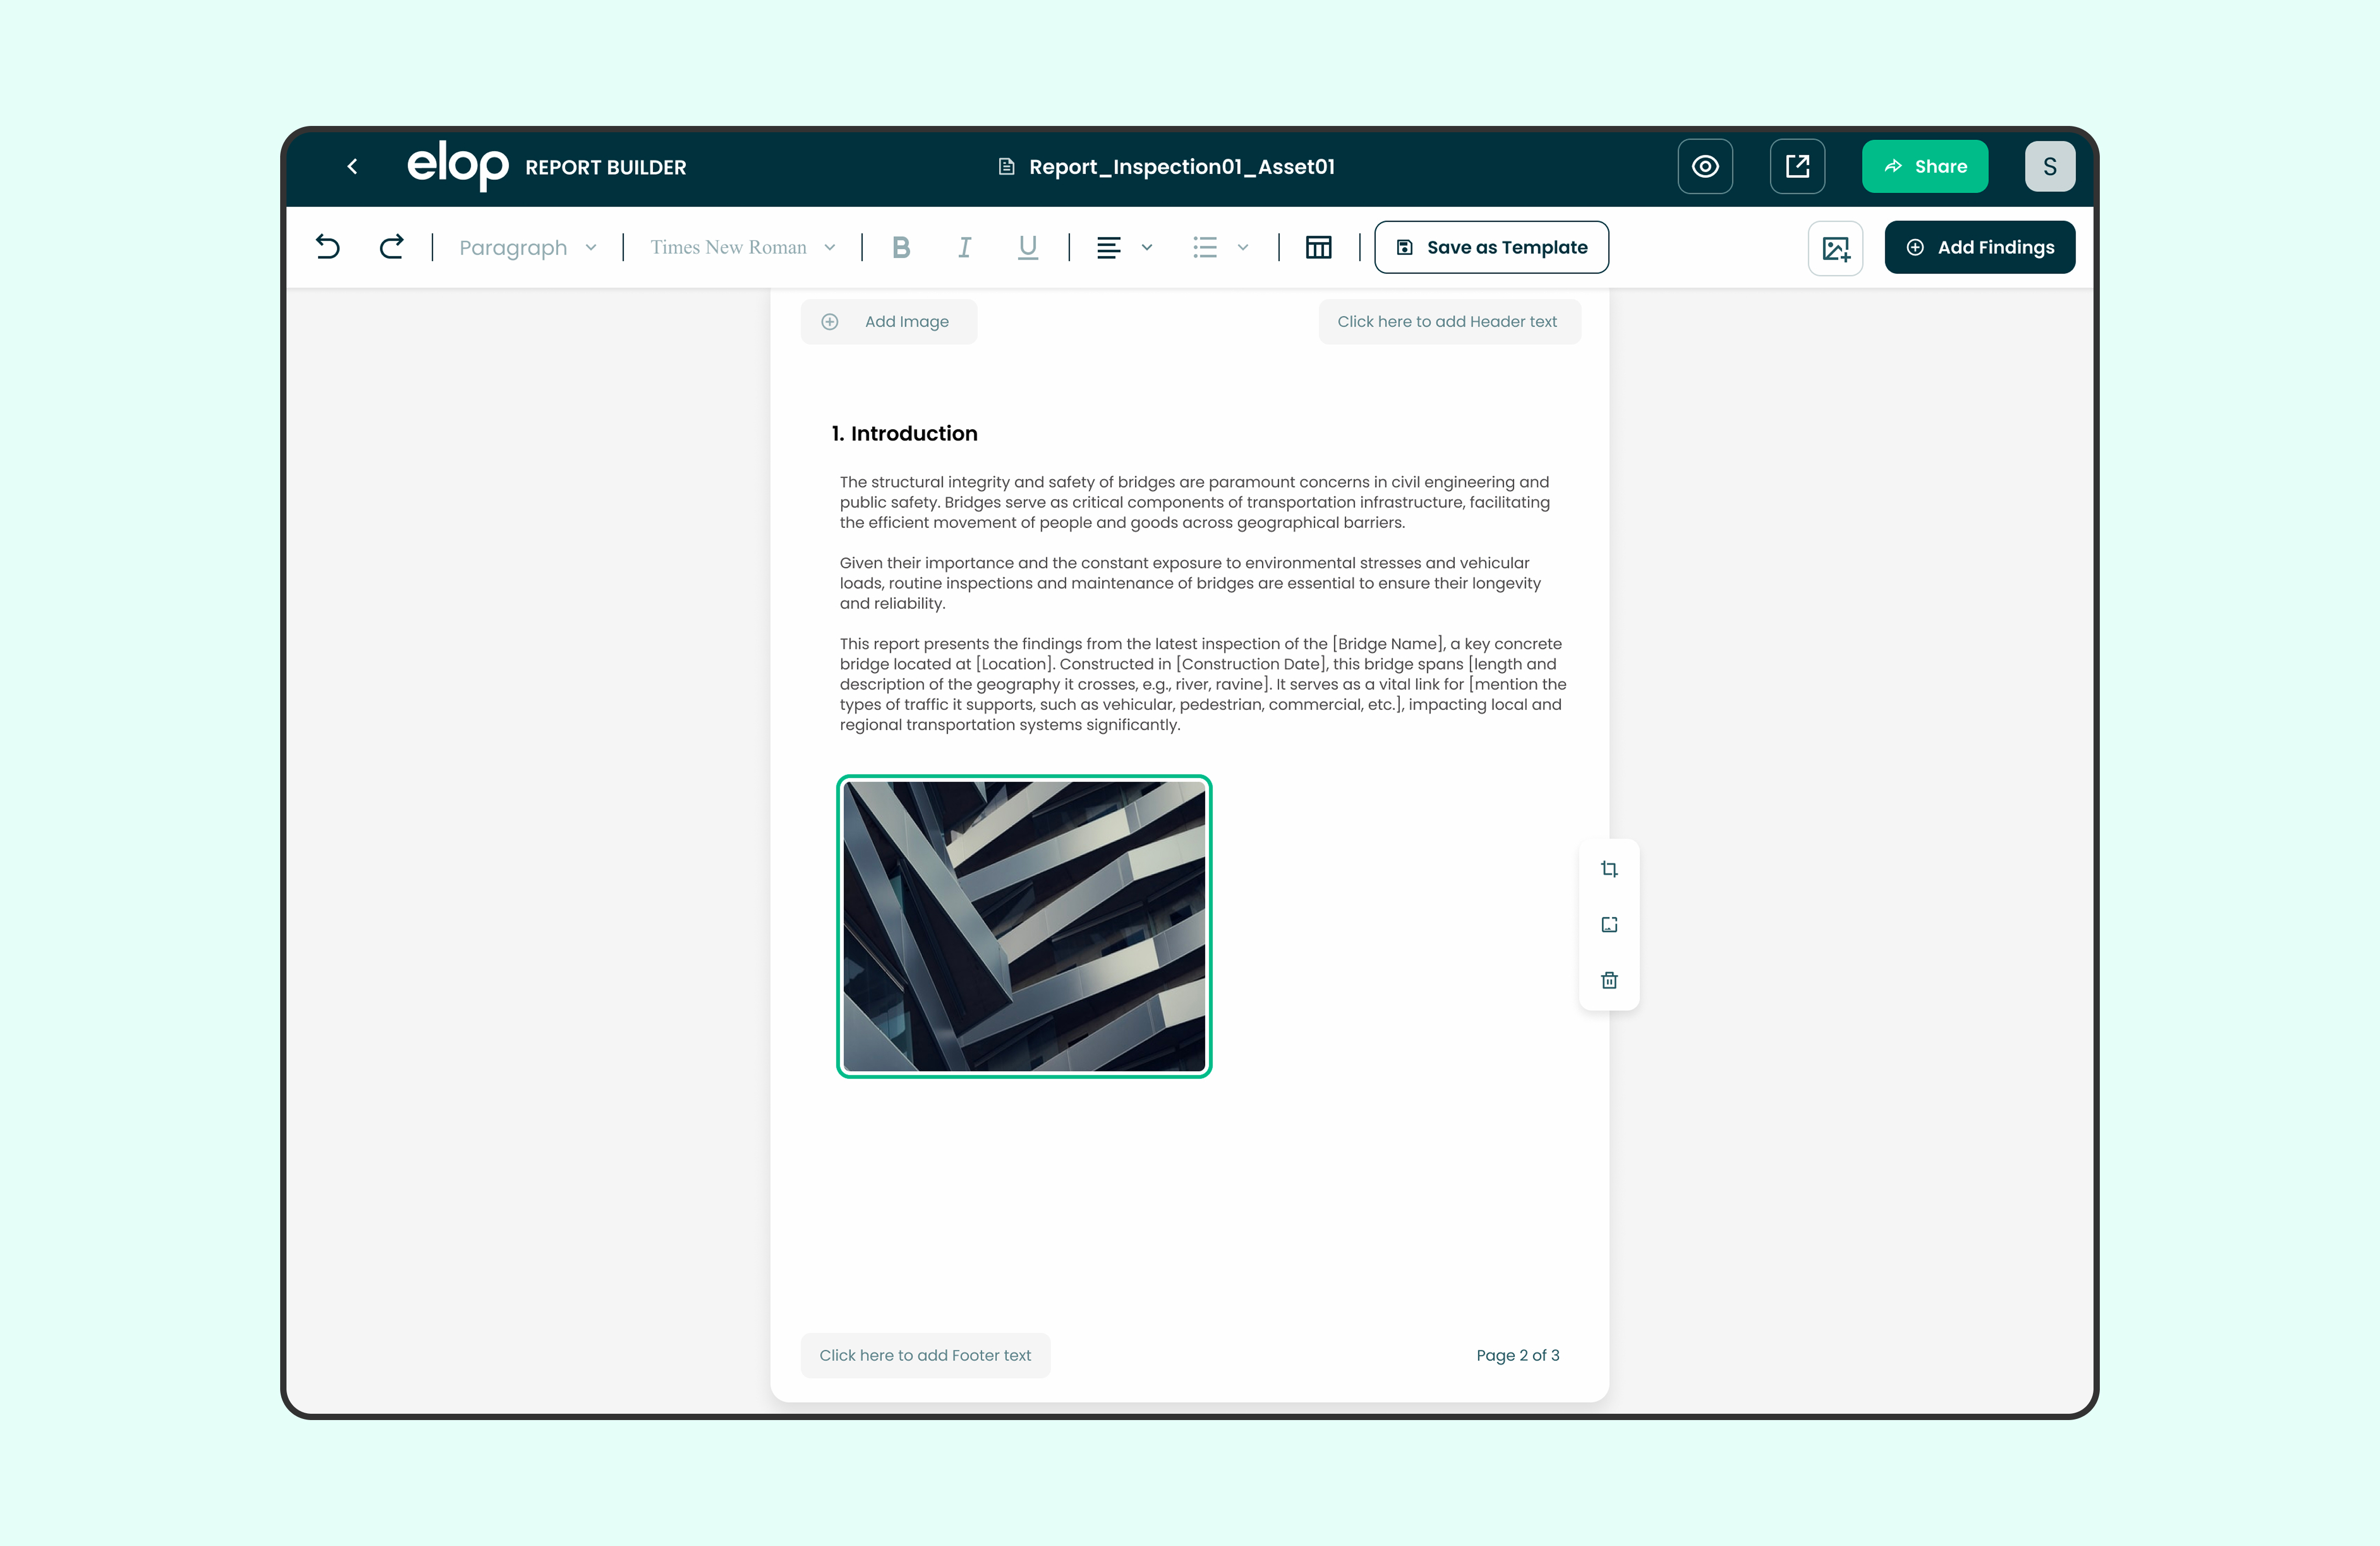
Closing the Reporting Gap
An integrated report builder for asset inspection teams.
An integrated report builder for asset inspection teams.
Elop's Insight platform helped inspectors and researchers analyze structural deformities in concrete assets like bridges and tunnels, but writing the official report meant leaving the platform entirely.
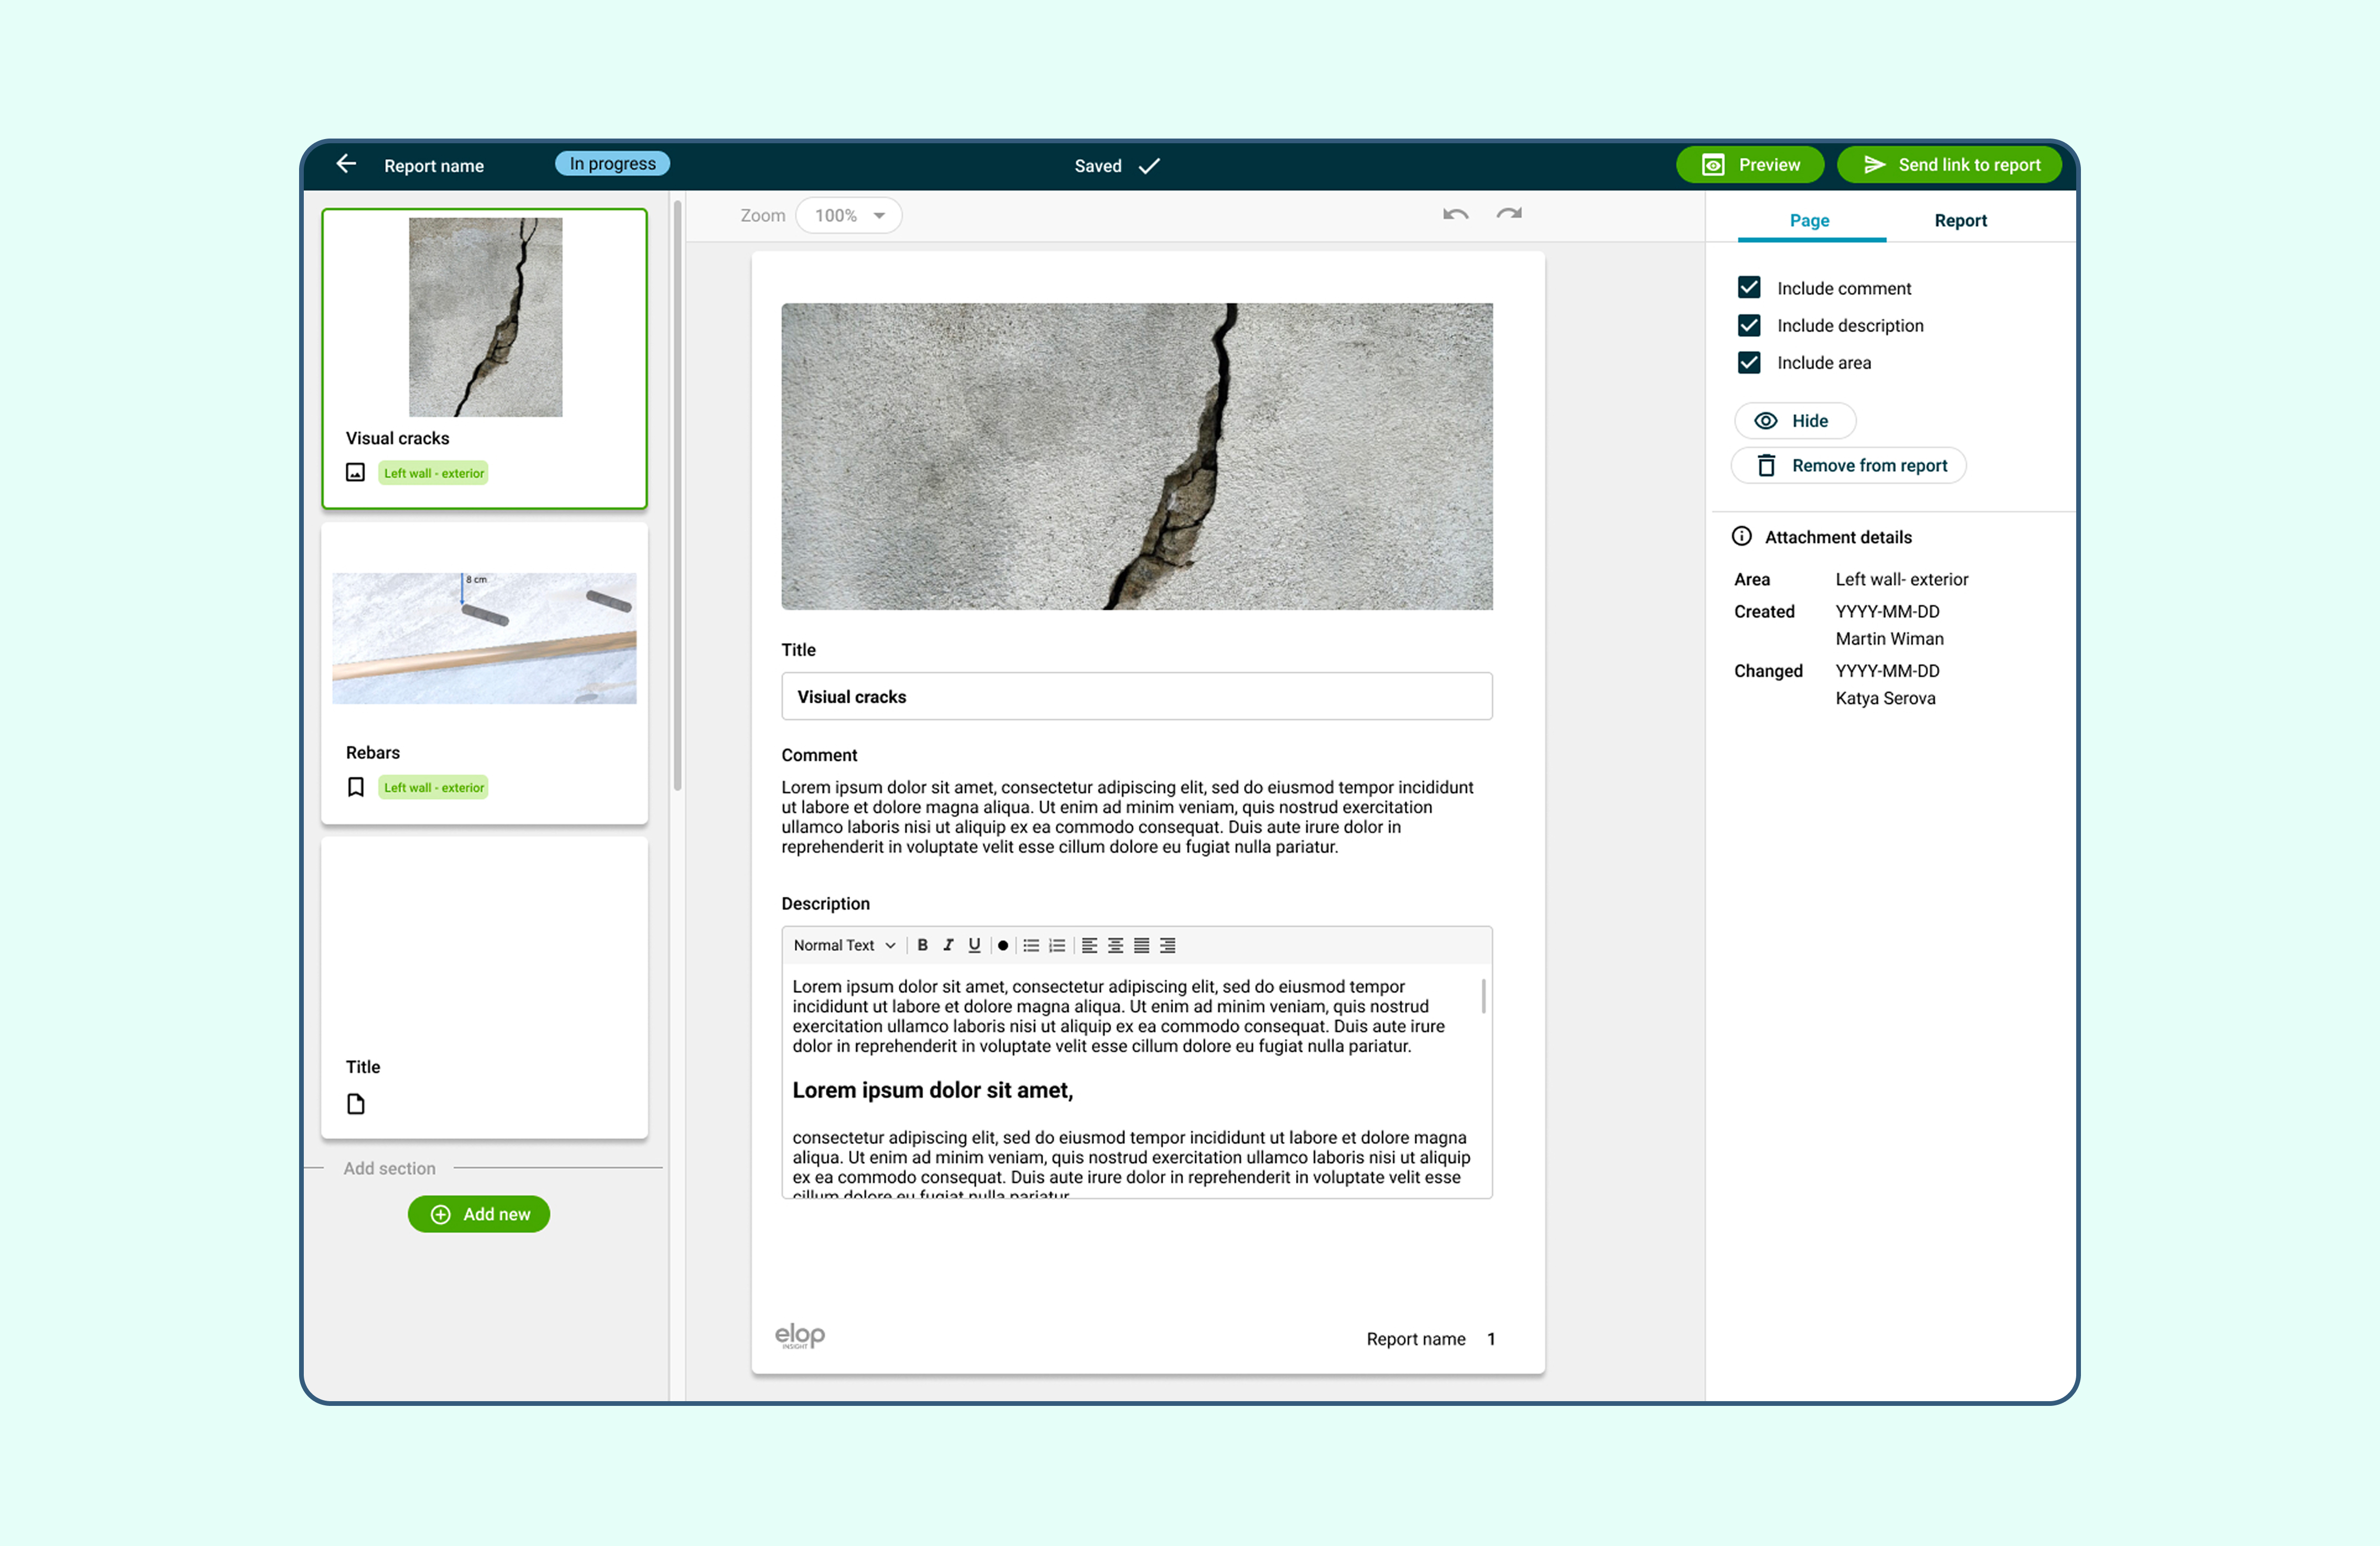
We designed a built-in editor that pulled scans, images, and findings straight from the inspection, added real text formatting, and let teams share and comment on reports without switching tools.
Report turnaround dropped from one to two weeks down to three days. Adoption rose 45% and spread beyond the original user base.
Elop's Insight platform gives inspectors and researchers a way to identify, analyze, and report on deformities in concrete structures such as bridges and tunnels, using non-destructive testing data. Teams scan a structure, the platform surfaces findings like cracks and rebar exposure, and someone then has to turn that analysis into an official report a client or authority can act on.
That last step was the weak point. This case study covers the redesign of the reporting workflow: how we found the gap, what we built to close it, and what changed once it shipped.
Note: the product shown in these screenshots was later rebranded from Insight to Elop AMS. The case study uses Insight throughout to match how the team referred to it during this project.
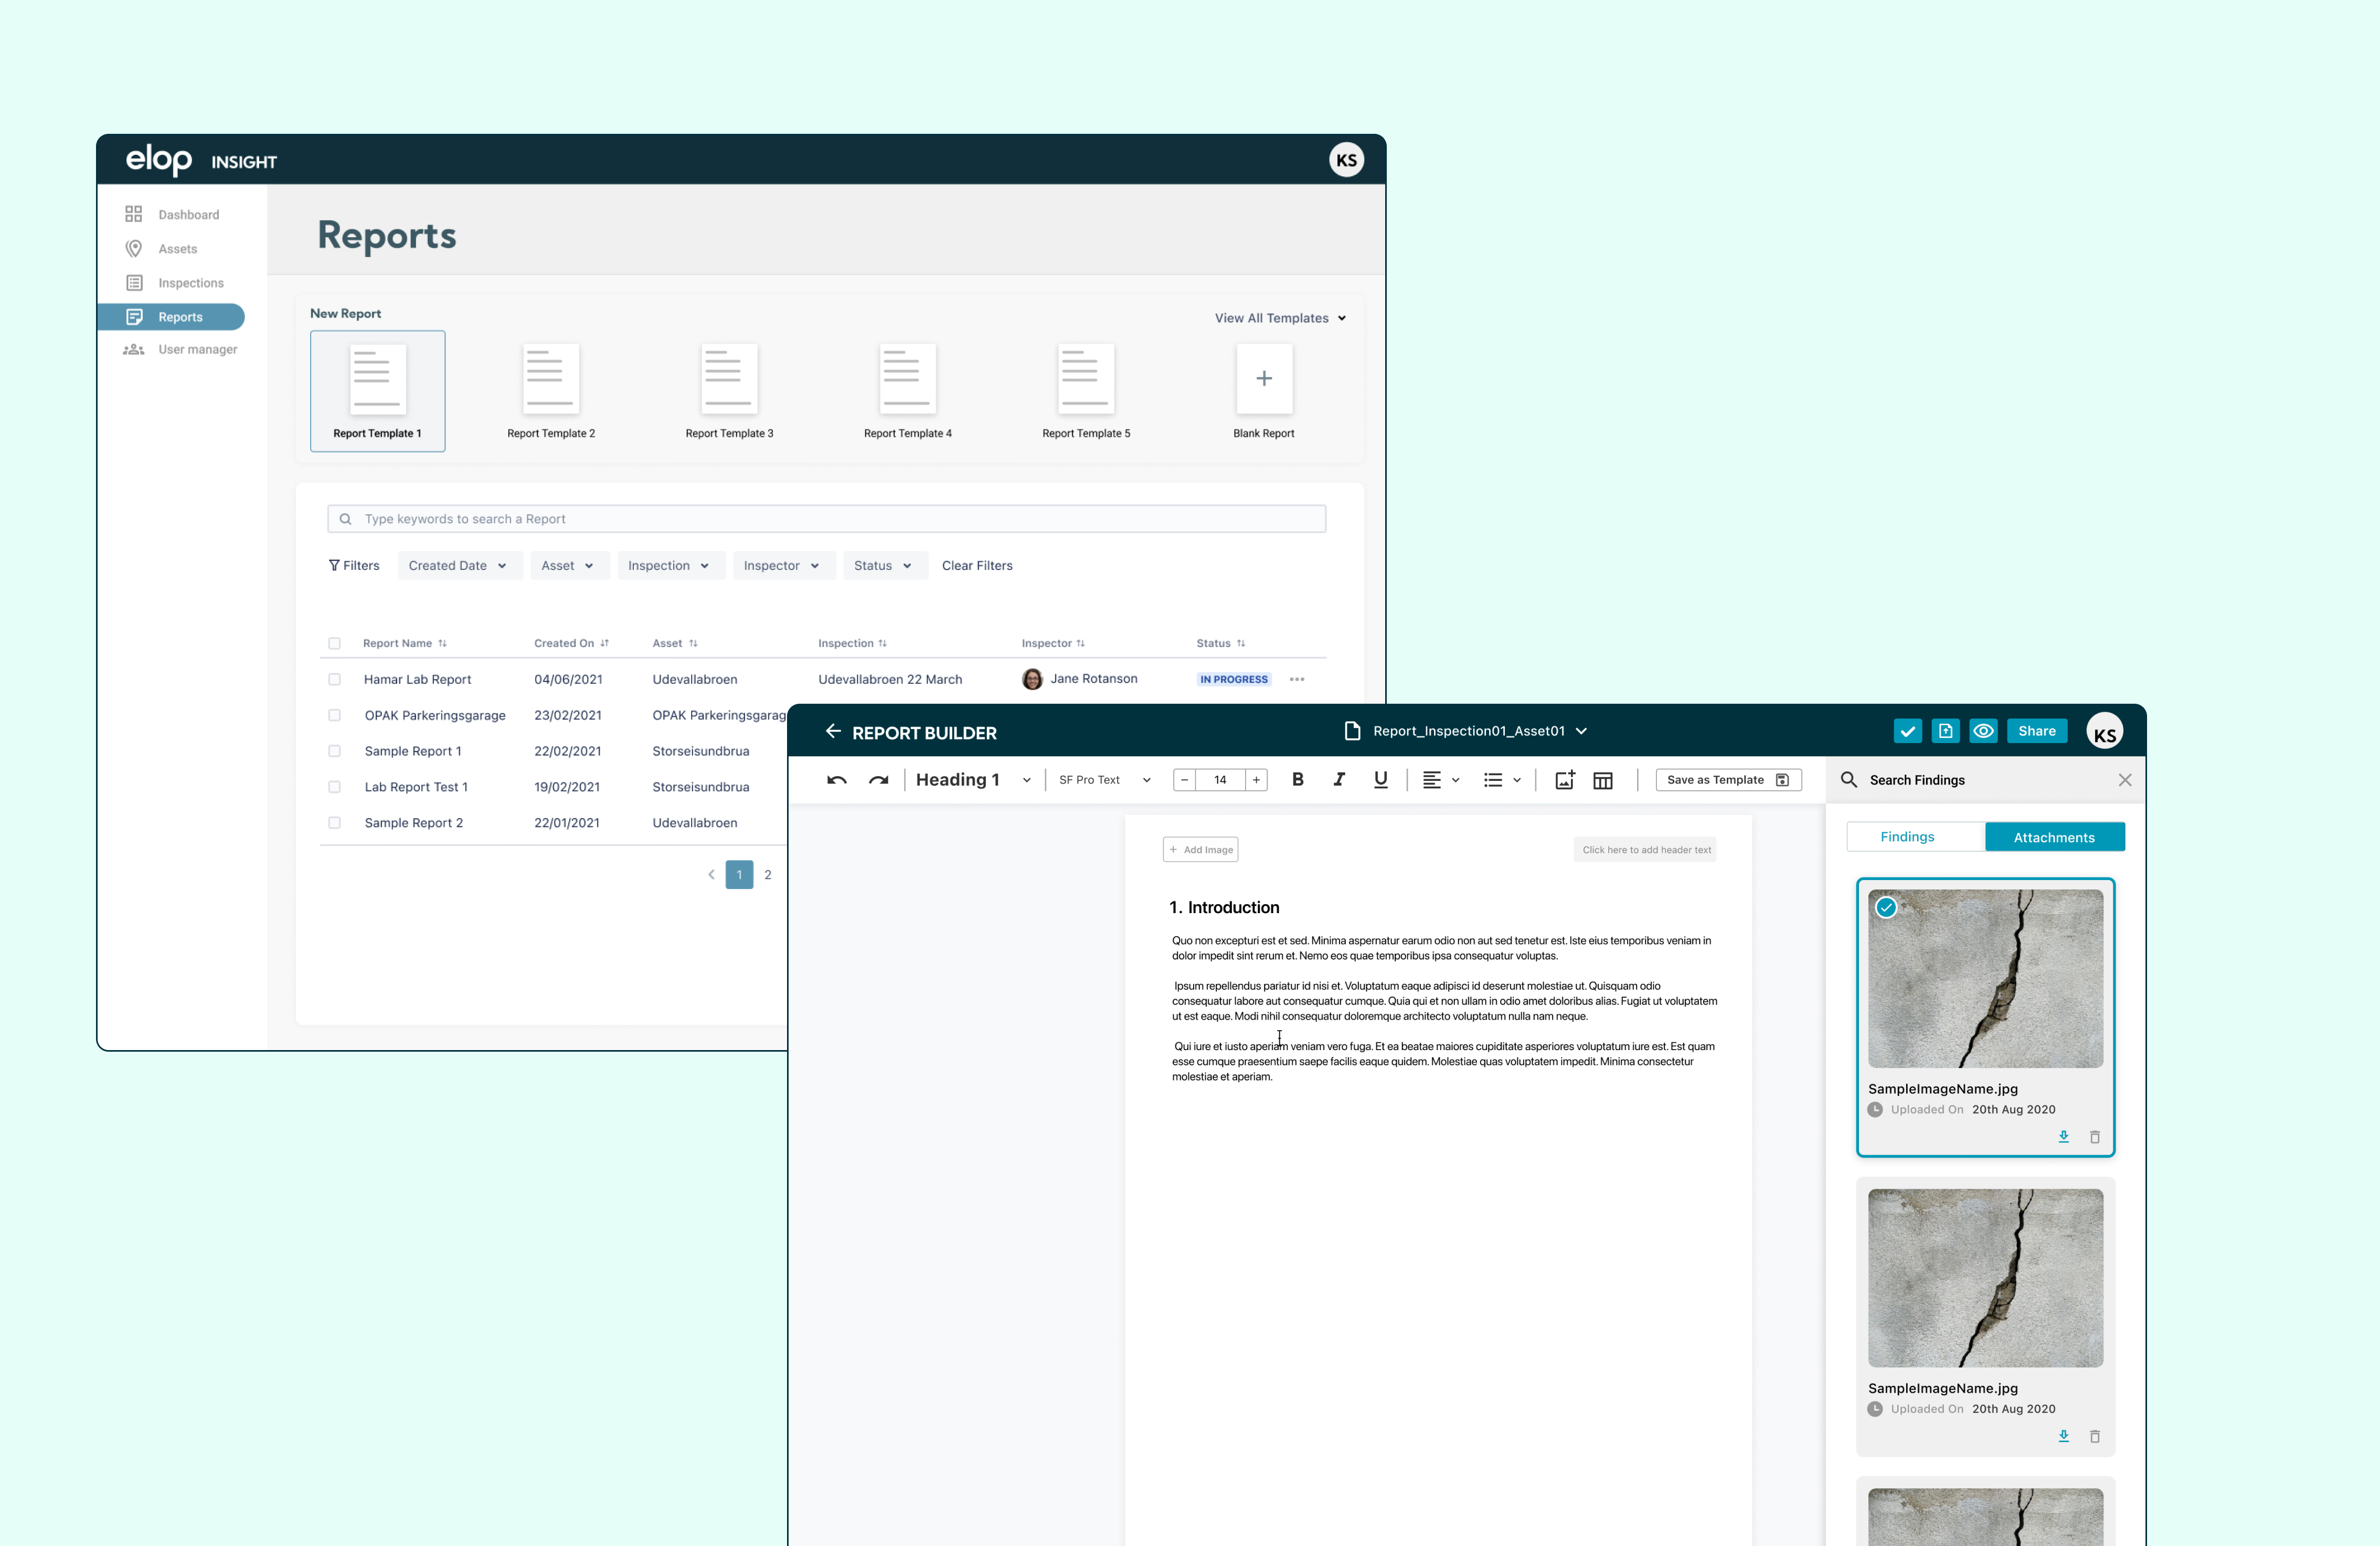
The report builder that shipped with Insight worked more like a slide deck than a document editor. Adding content meant fighting a rigid, slot-based layout, and the text tools stopped at basic formatting, nothing close to what a Word or Google Docs user expects. Every new report also meant manually pulling in scans and images from the inspection rather than having them already there.
The result was predictable: inspectors and researchers gave up on the built-in tool and wrote reports in Word or Google Docs instead, then pasted the finished document back in or sent it separately. That broke the connection between the inspection data and the report meant to represent it, and it left no way for a peer or manager to review and comment before a report went out.
Give researchers a report editor that feels as familiar as Word or Google Docs, but that stays connected to the inspection data underneath it, and that lets a team review a report before it goes out.
We interviewed four researchers and three inspectors who build reports from NDT (non-destructive testing) inspection data, to understand where the current workflow broke down and what a better one would need to do.
A few patterns came through clearly. Reports needed to stay linked to a specific asset and inspection, since one asset could have many reports over time. Researchers tended to write the report while inspectors contributed data like scans and images, so the roles split the work rather than sharing one screen. Reports moved through peer review and sometimes manager approval before publishing. And people wanted to get a report out in a plain, offline-friendly format like PDF once it was done.
“I need the scan sitting next to the paragraph about it, not in a folder I have to go find.”
Wants to write a conclusive report without leaving the platform, pulling scans and findings straight into it as she writes.
Blocked by a rigid, slide-like layout and manual re-upload of inspection data for every new report.
“I can hand over the images, but I have no way to leave a note on the report before it ships.”
Wants to contribute scans and images quickly, then review and comment on the report before it goes to a client.
Blocked by a share-only link with no way to comment, review, or flag something before publishing.
The clearest signal from research wasn't a feature gap so much as a familiarity gap. People already knew how to write in Word and Google Docs, and every minute spent relearning Insight's editor was a minute not spent on the report itself.
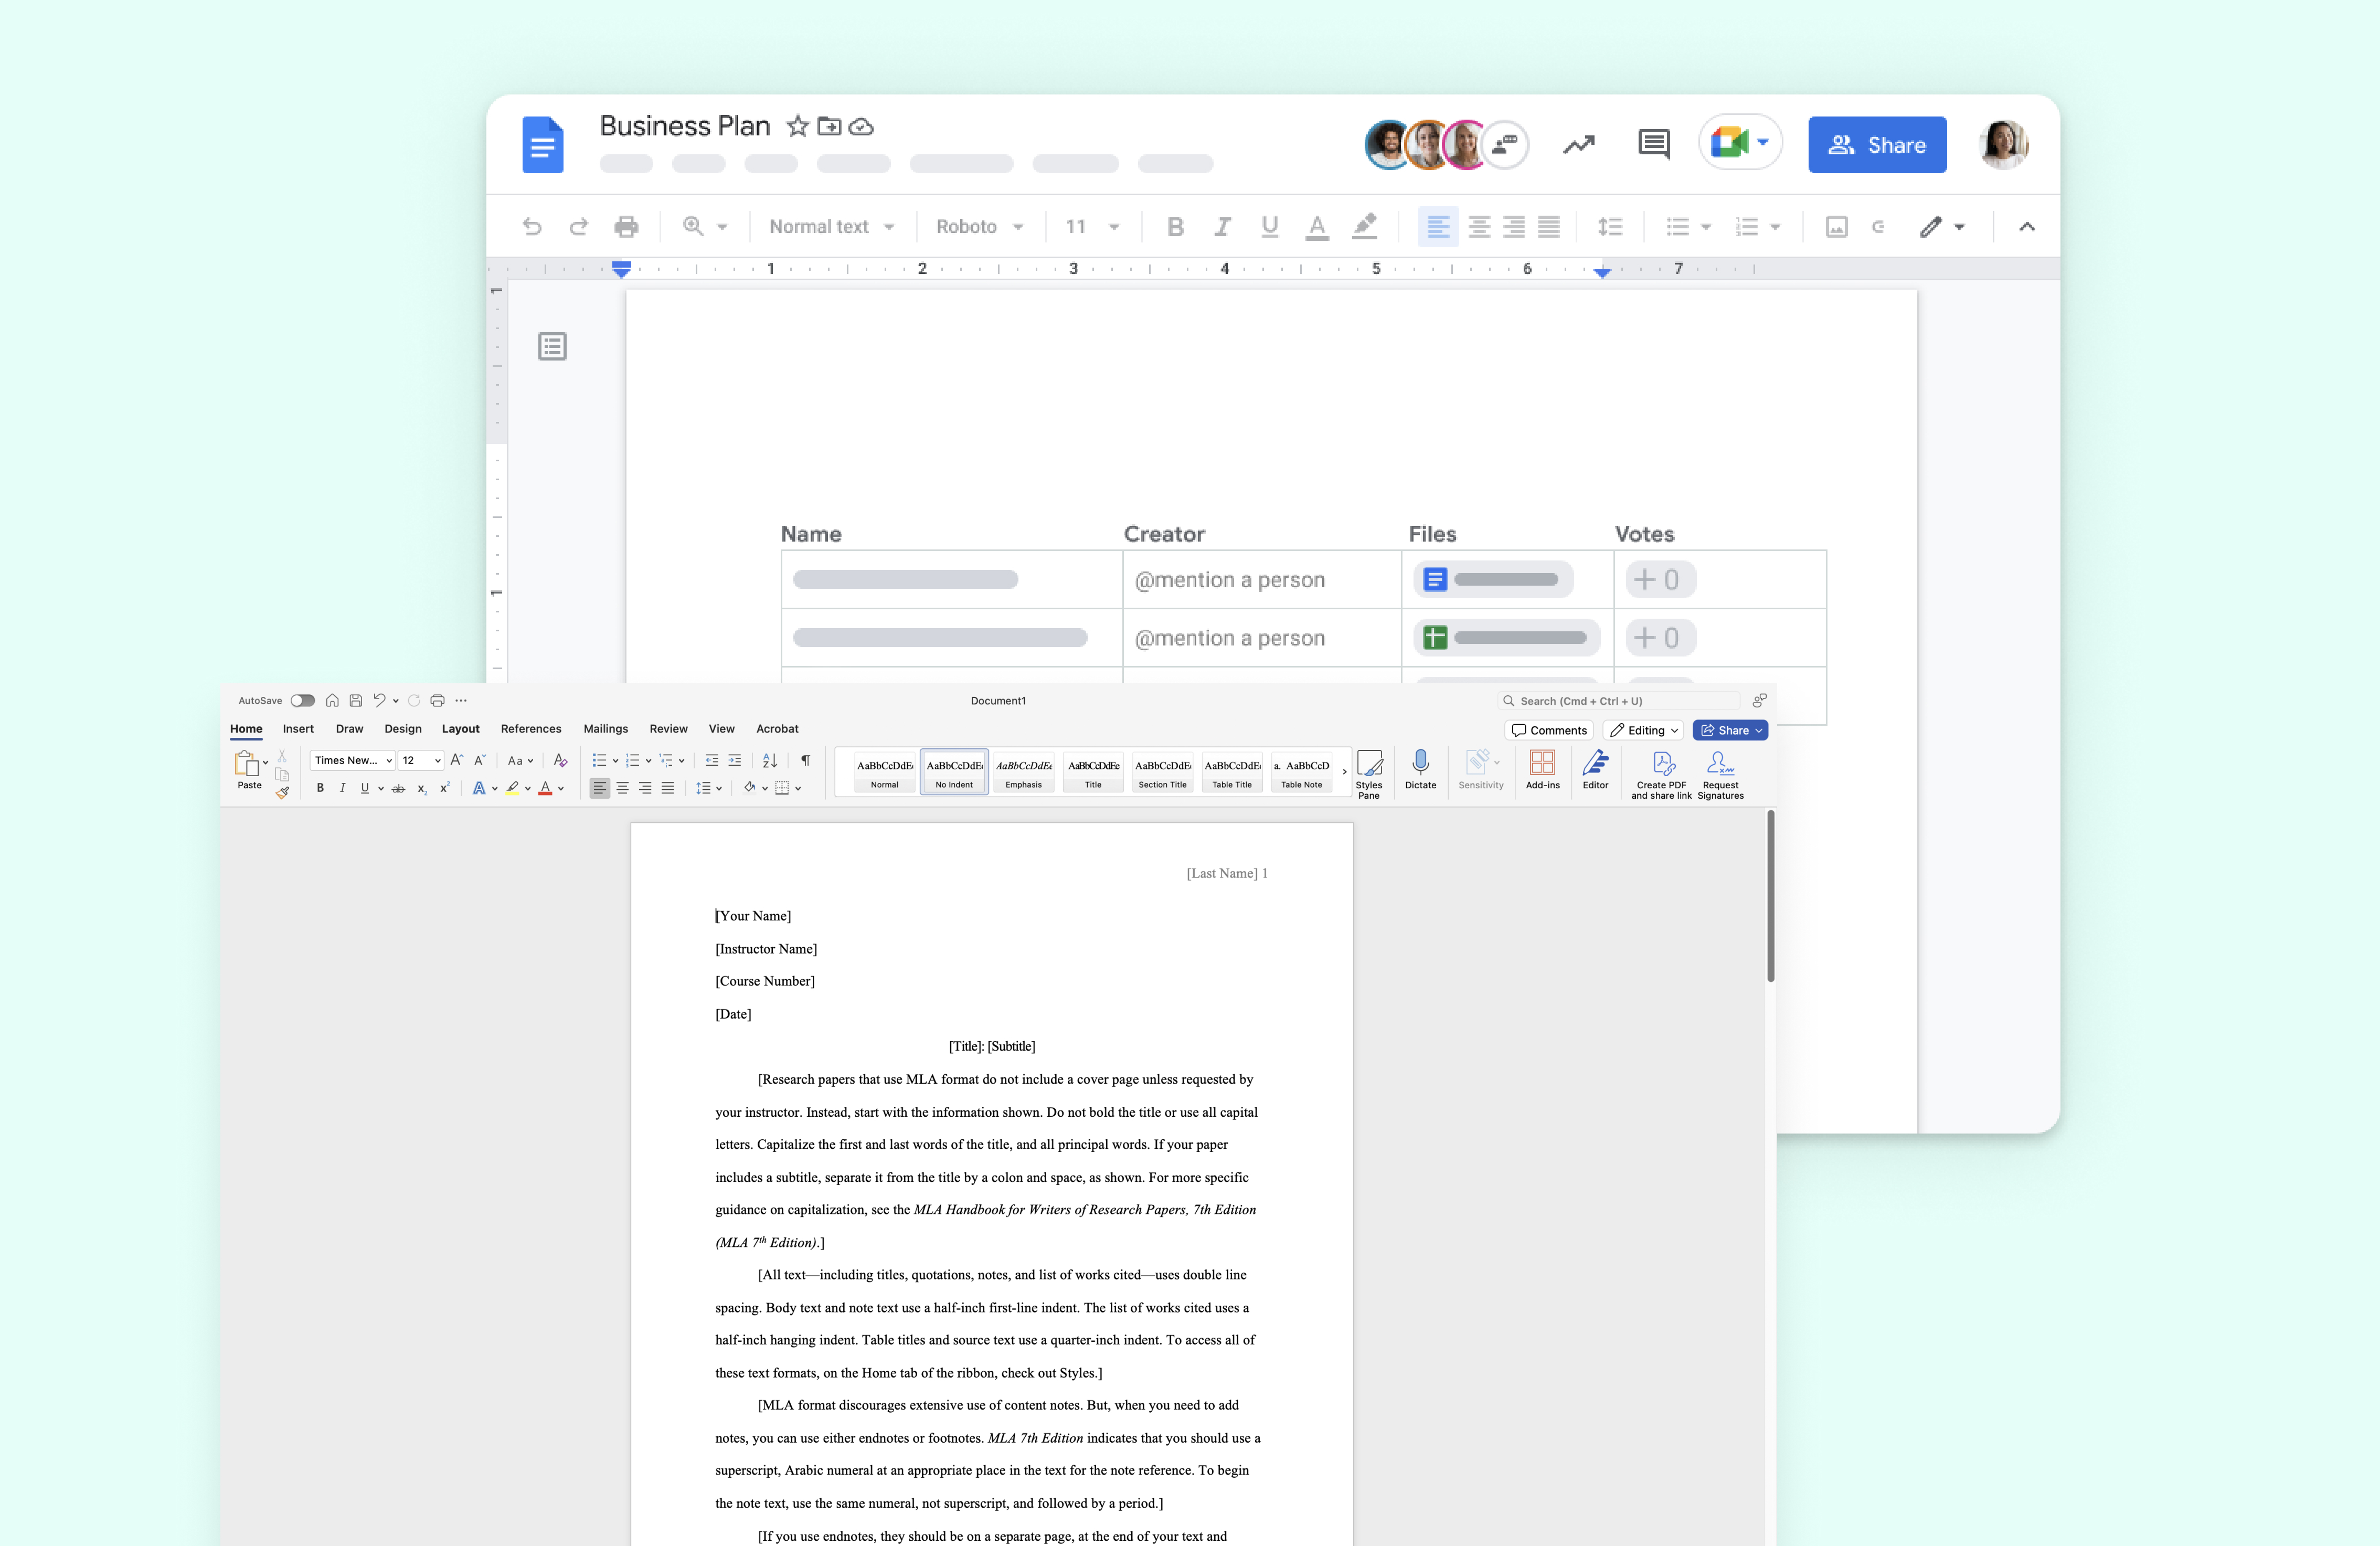
| Tool | Strength | Gap for our users |
|---|---|---|
| Microsoft Word | Full formatting, familiar to every researcher | No link to inspection data, fully manual |
| Google Docs | Real-time collaboration, comments, easy sharing | Same disconnect from inspection data, plus a second system to manage |
| Elop Insight (before) | Native access to scans and findings | Slide-like layout, thin formatting, no review flow |
The takeaway was direct: match the editing experience people already trusted, then win on the one thing Word and Docs could never offer, a live connection to the inspection itself.
With the research synthesized, we sorted the possible solutions into what the redesign needed to ship with and what could wait, then started sketching.
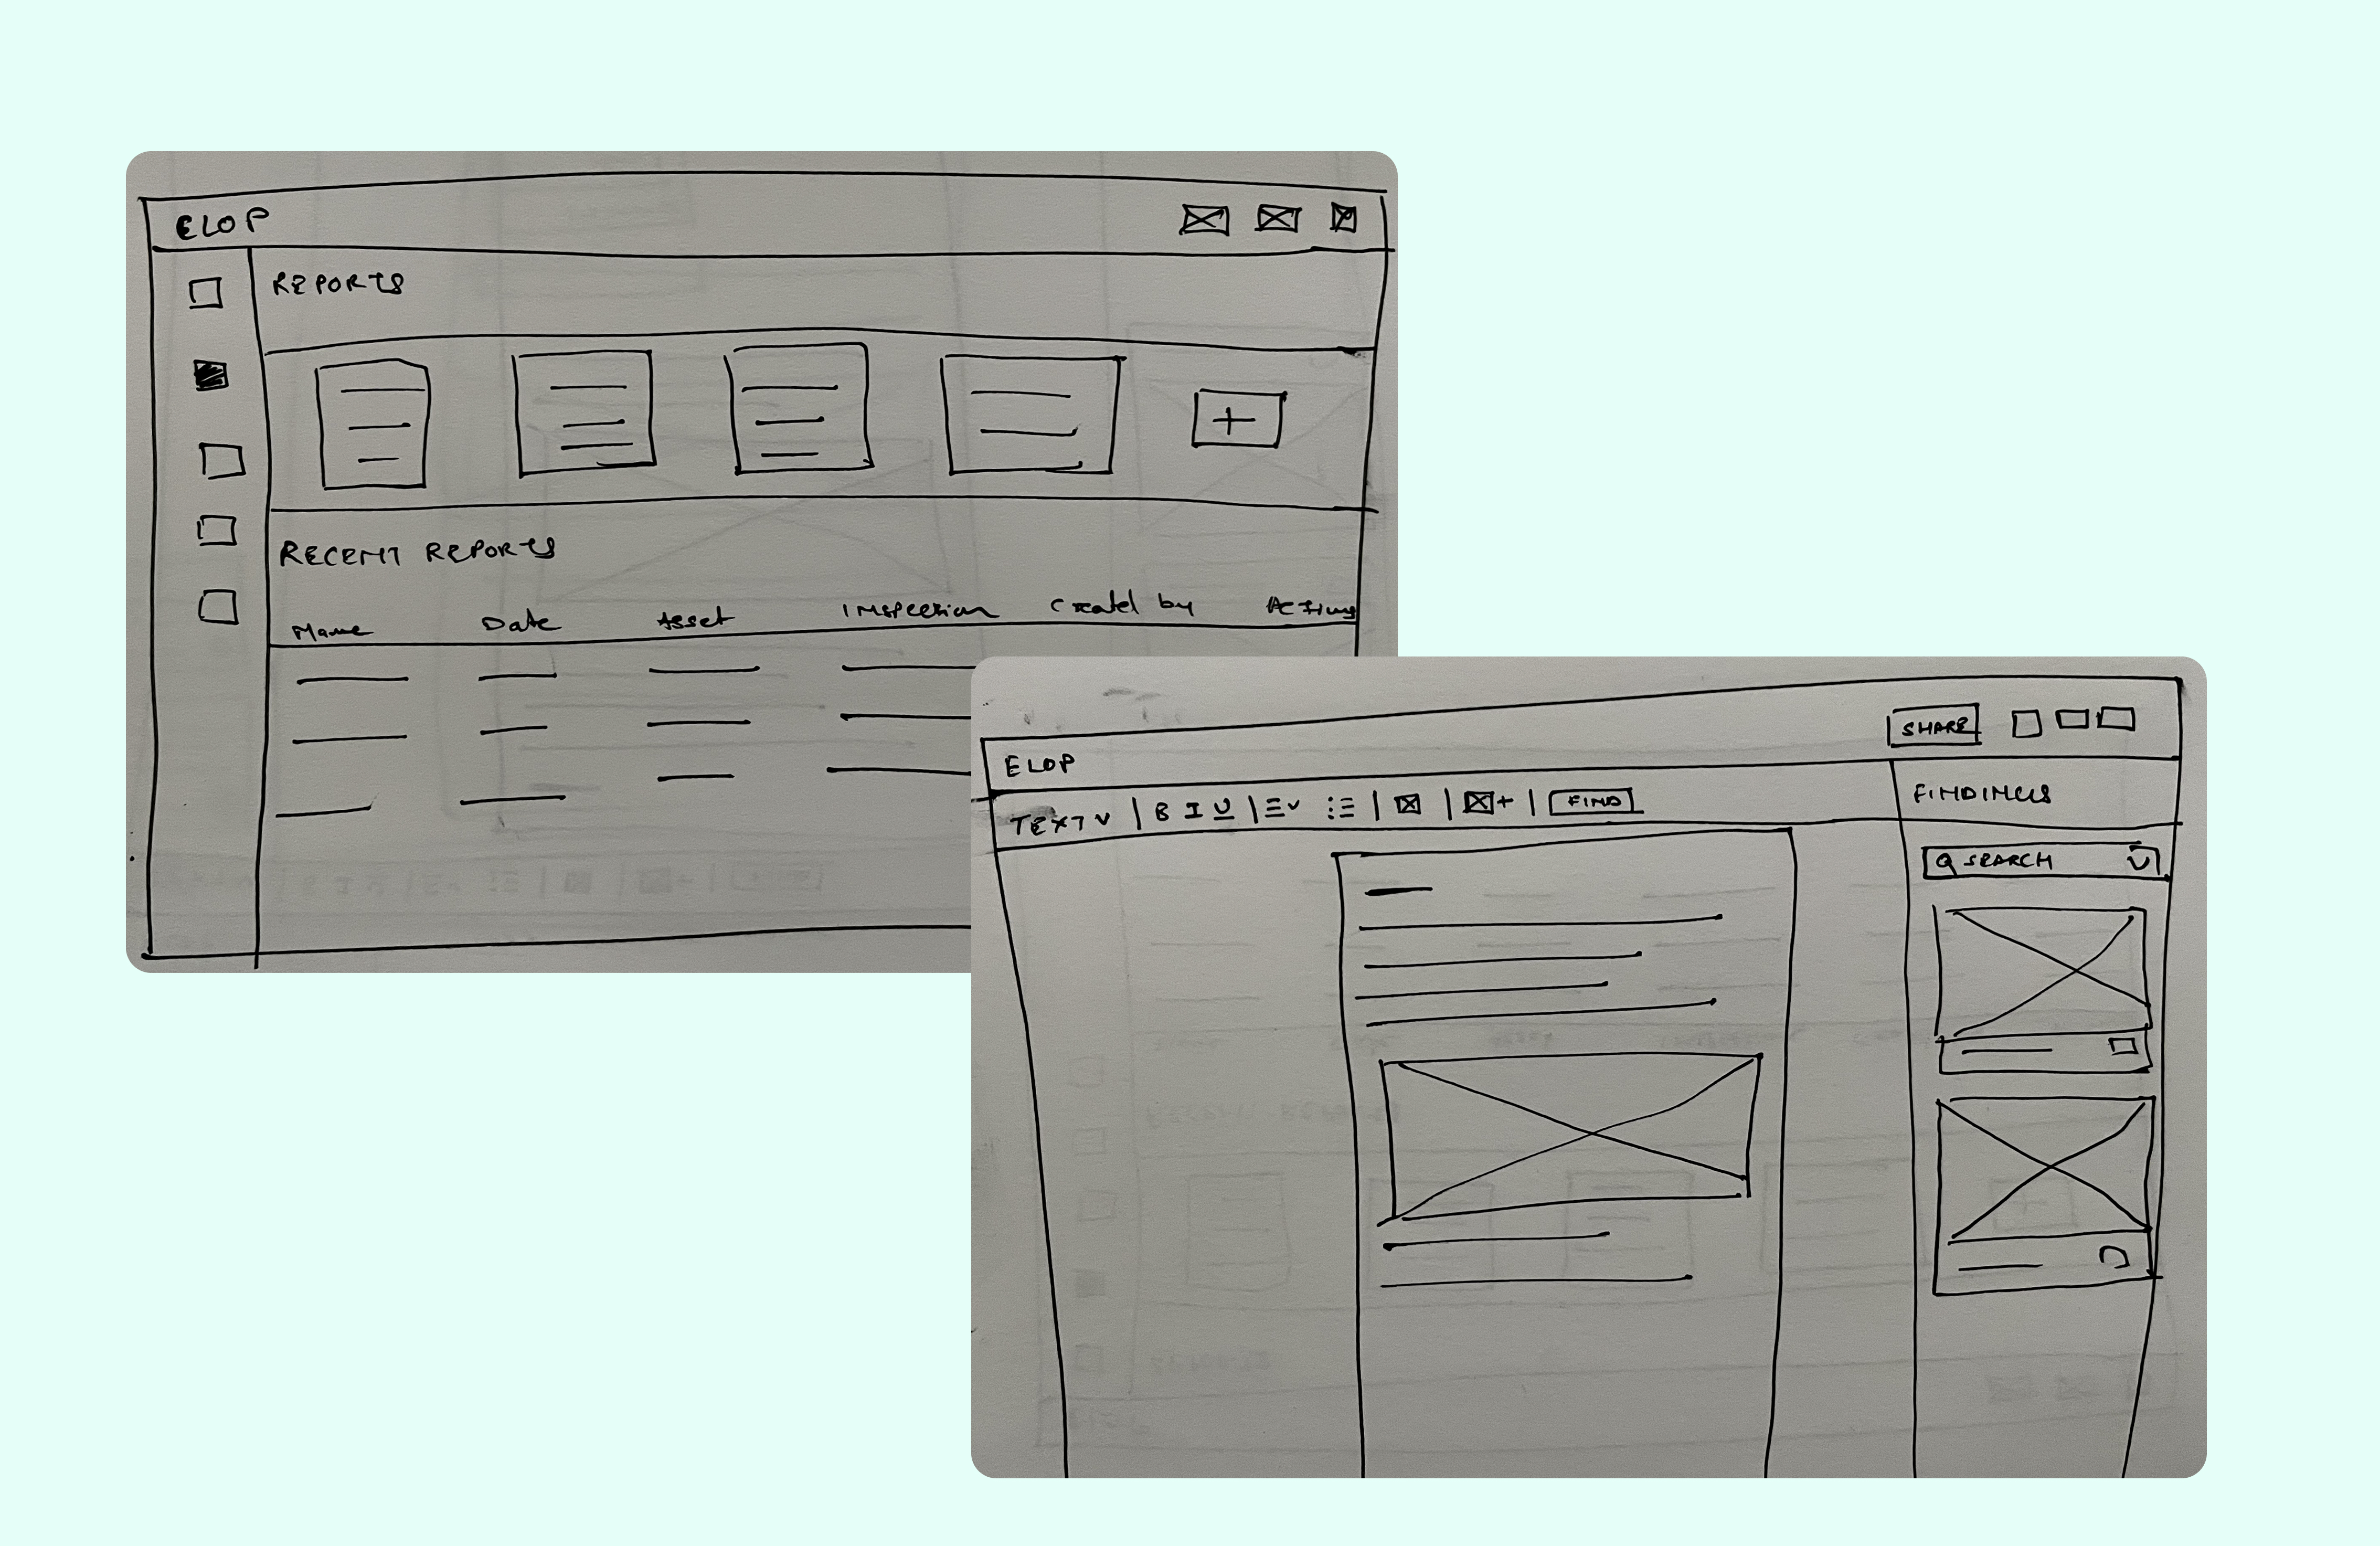
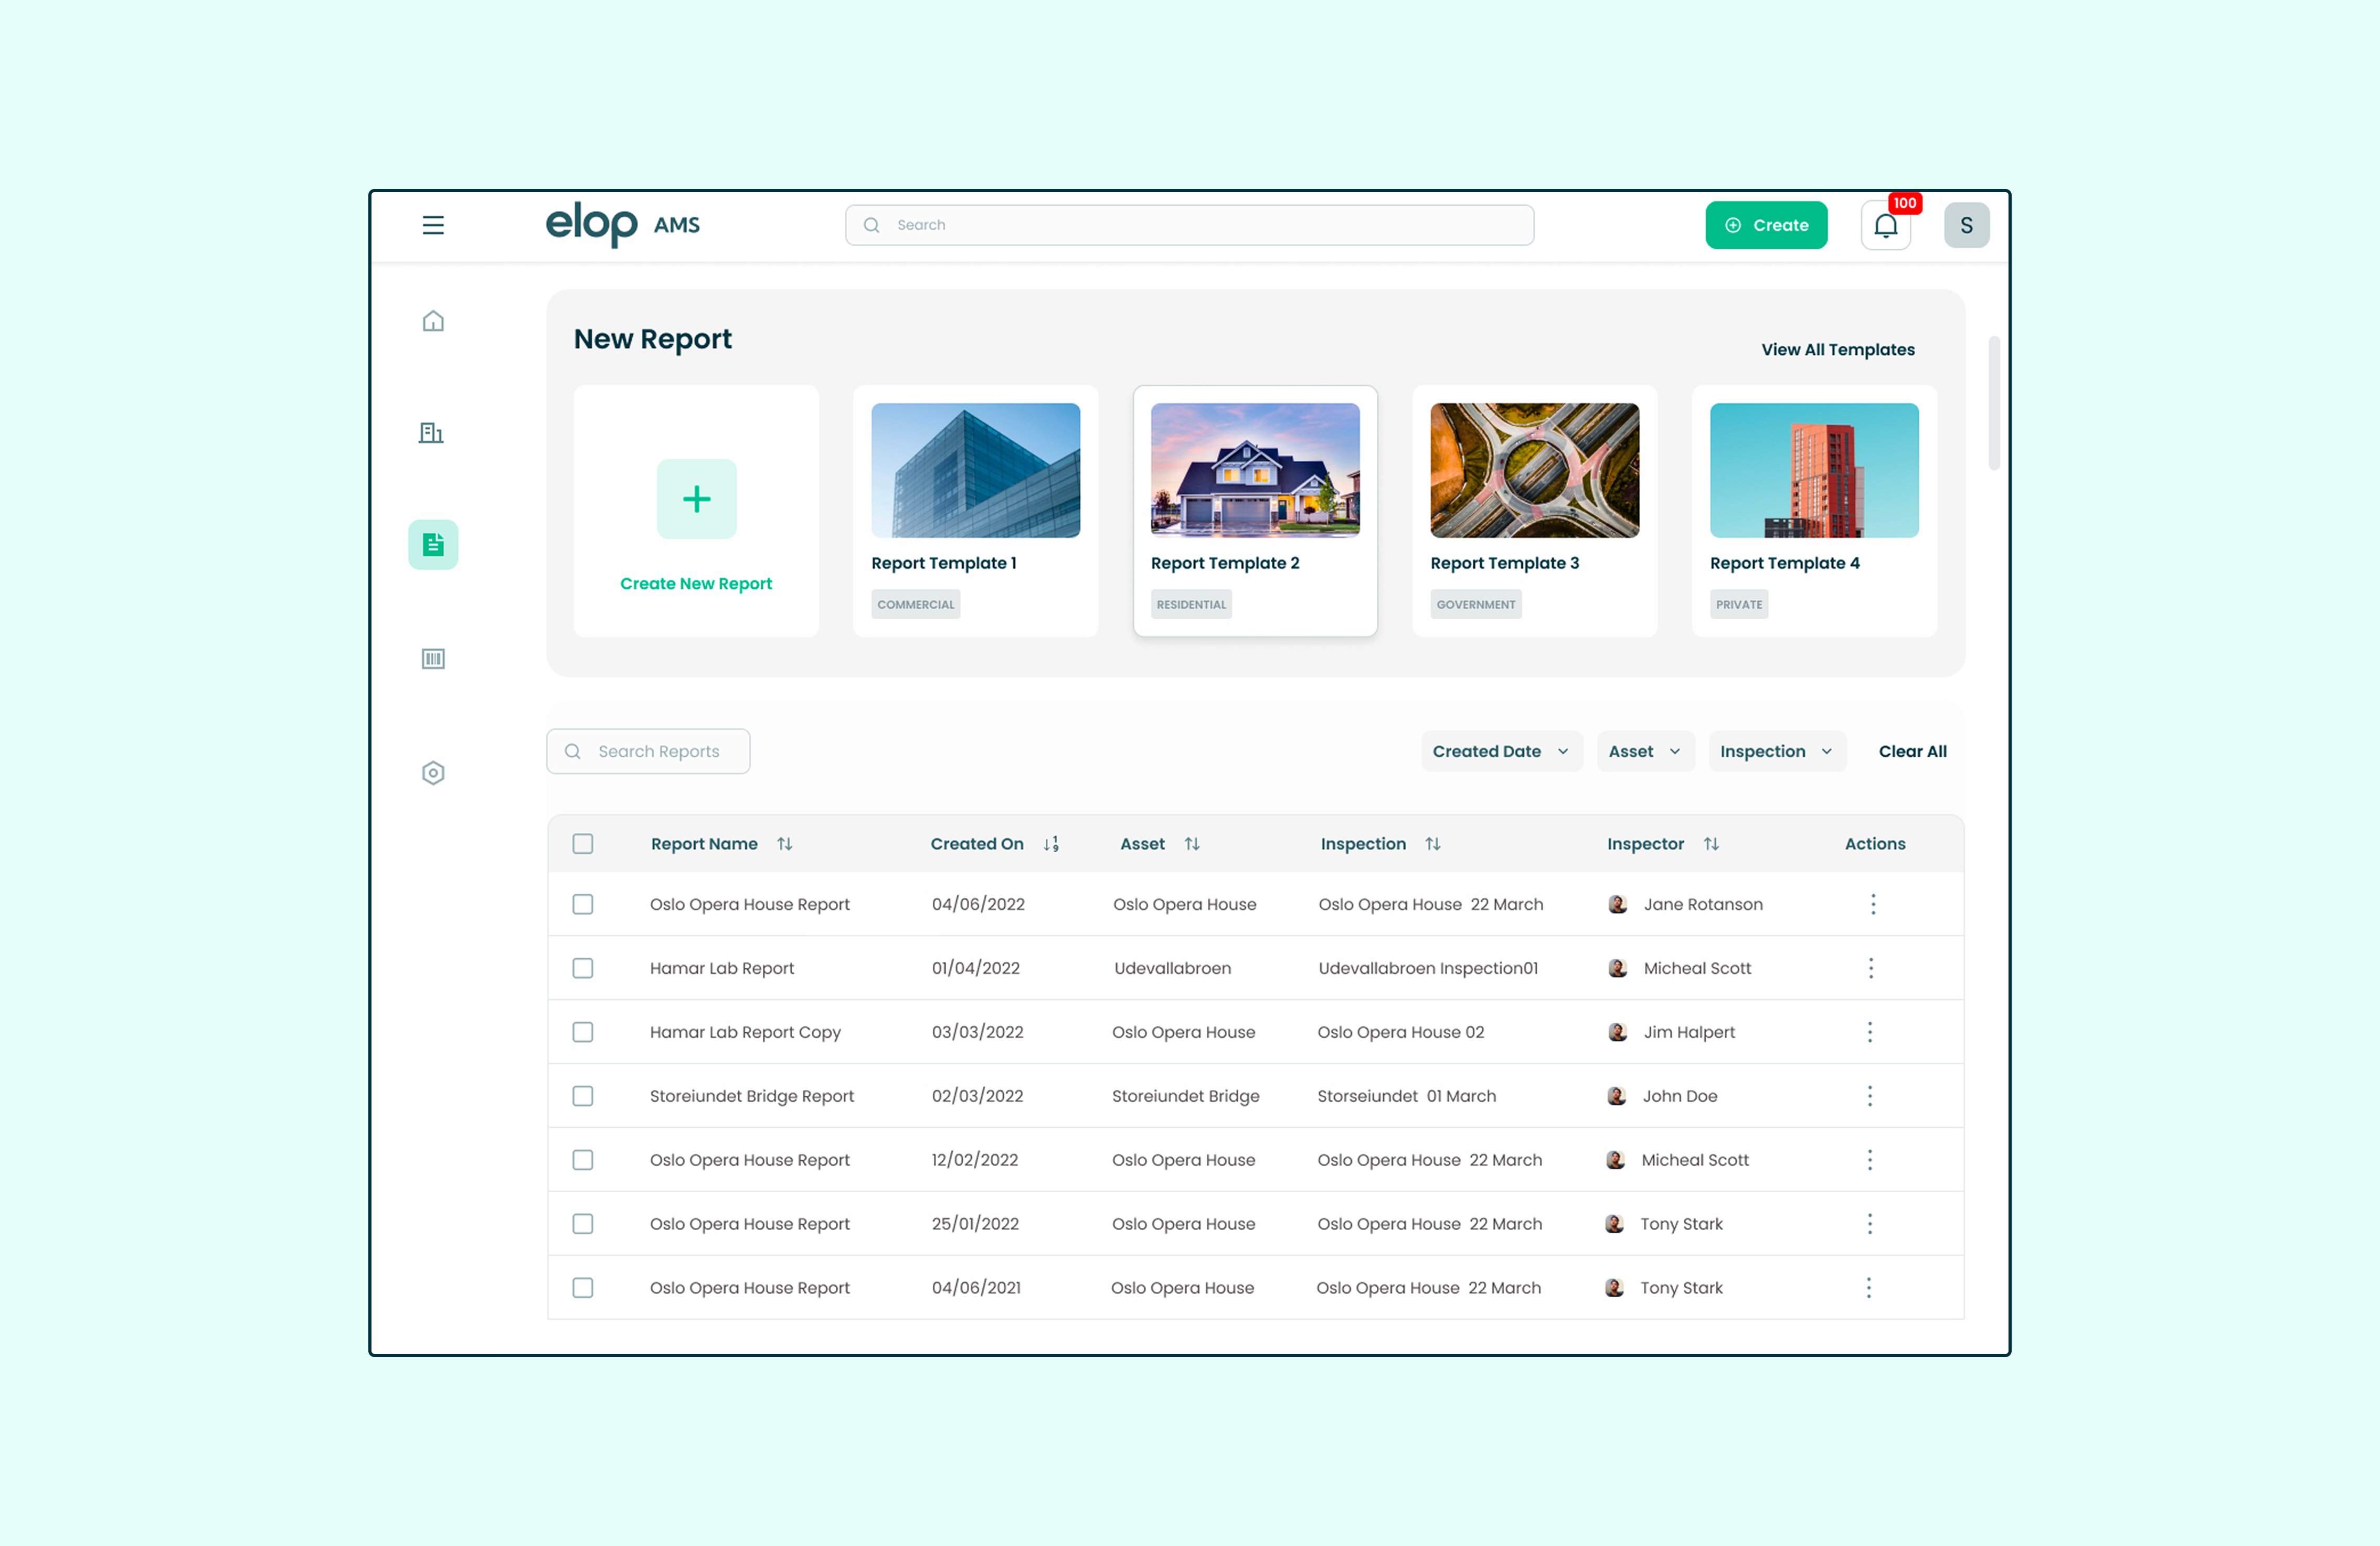
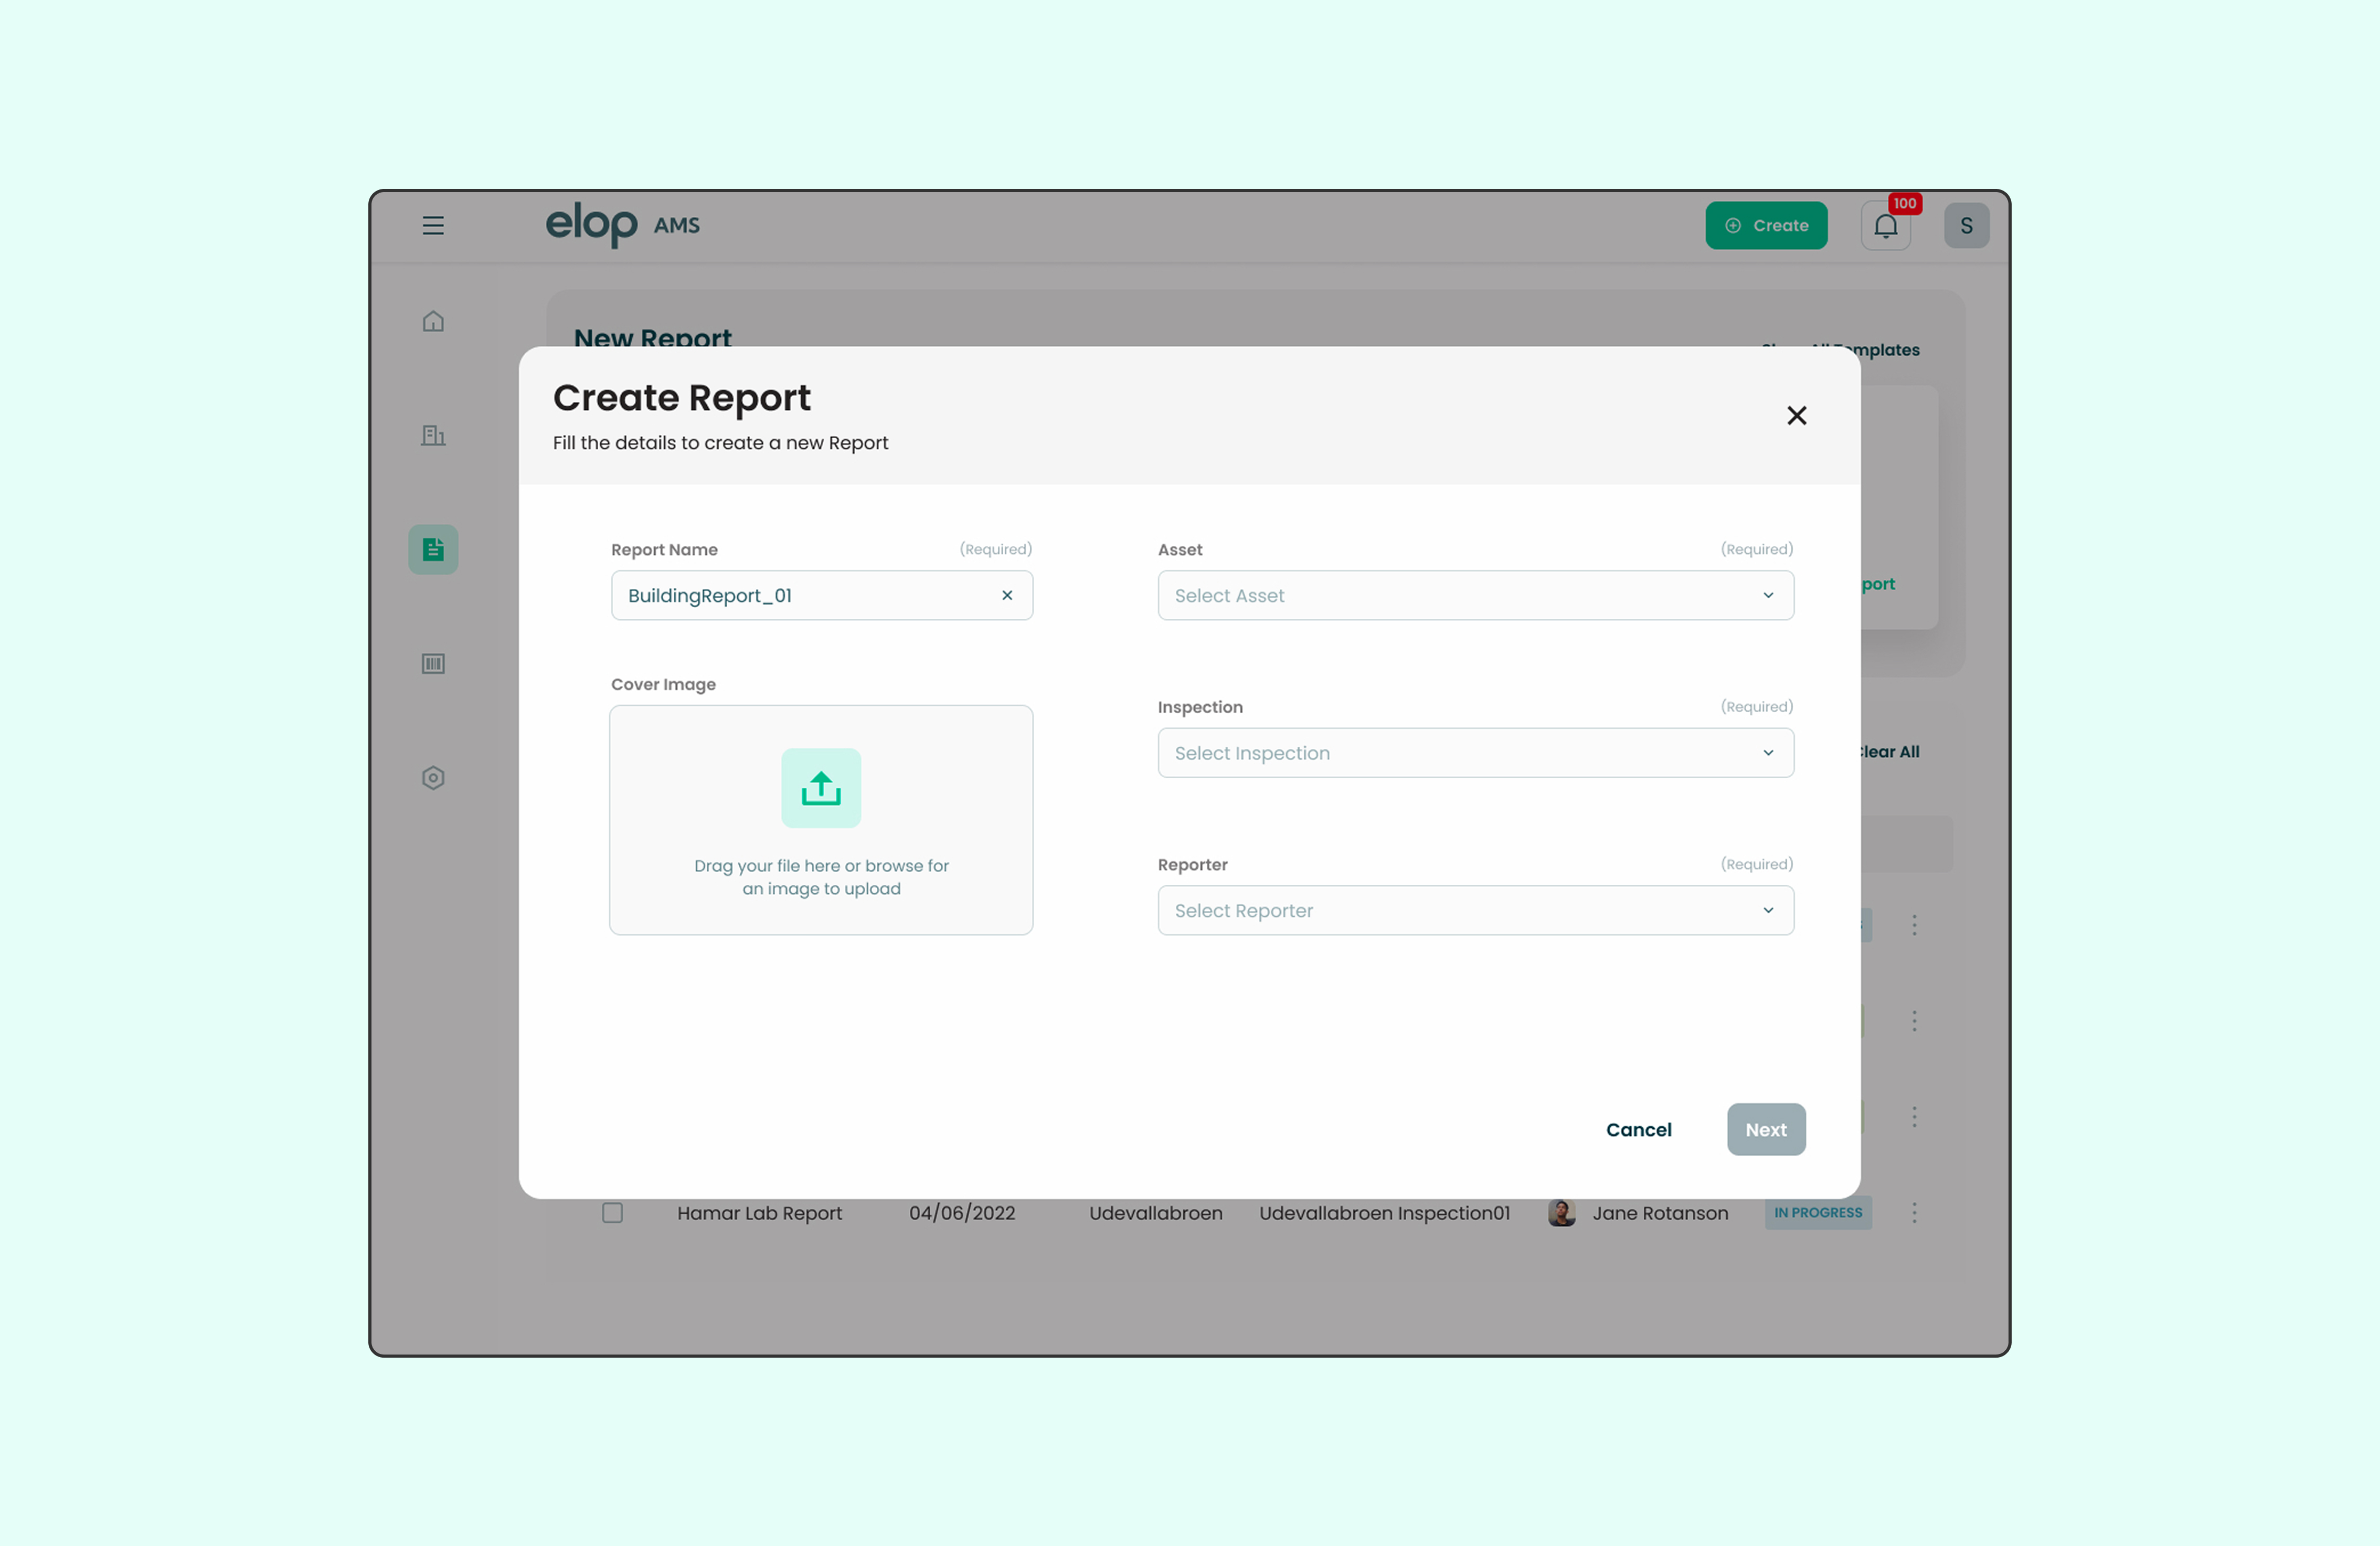
Creating a report starts with a short form: name it, pick the asset, pick the inspection, and Insight already knows which scans and images belong to it. From there the report opens straight into the builder, which now behaves like a real document editor rather than a stack of slides. An "Add Findings" panel sits alongside the document, filterable by scan, model, and severity label, so pulling in the right image is a search and a click rather than a download and a re-upload. Once a draft is ready, a share flow invites people inside or outside the organization to comment directly on the report, in place.
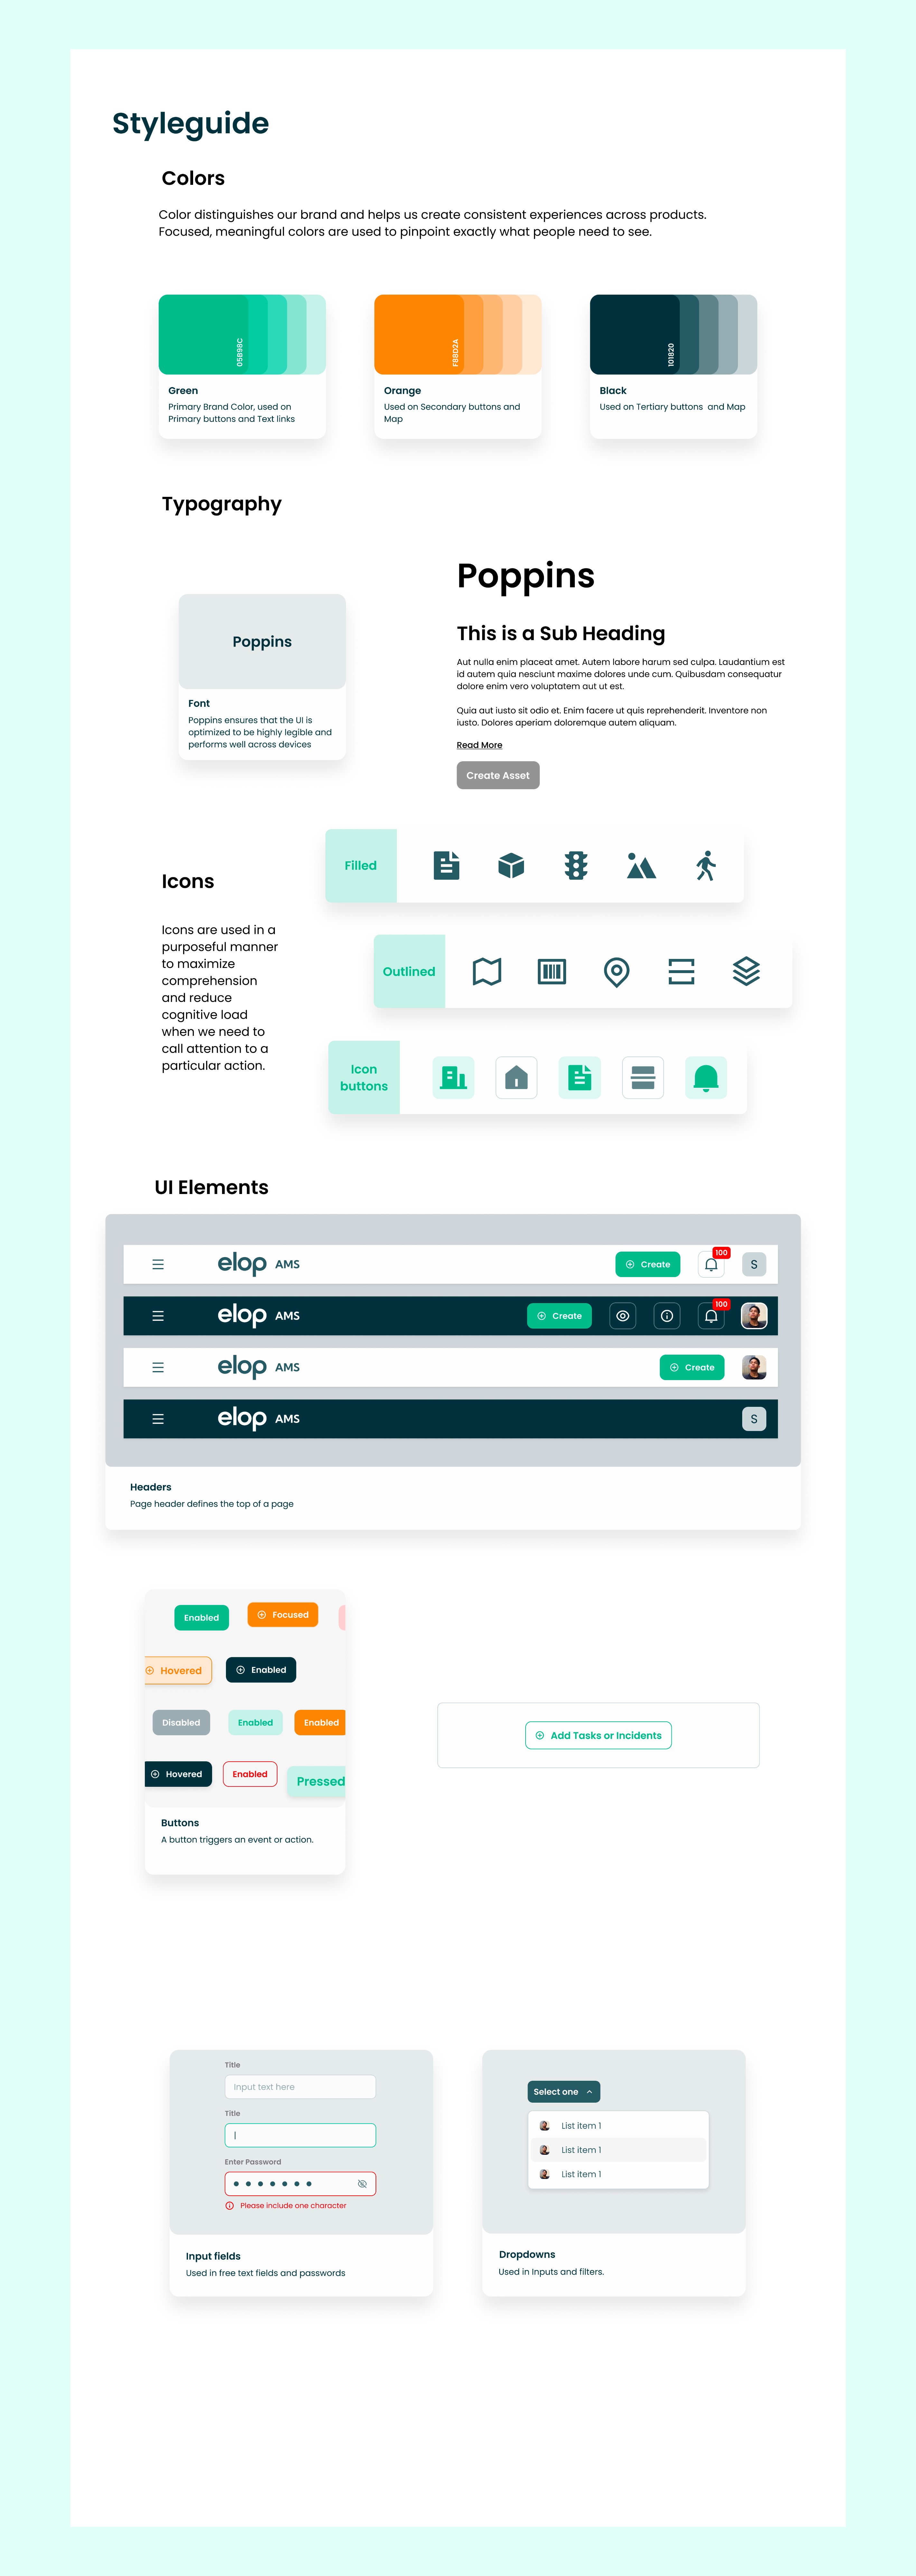
We also carried over the product's existing design system rather than inventing a new one, keeping the new editor visually consistent with the rest of Insight.
Five screens in the order a report moves through them. Use the arrows or the dots, swipe on a trackpad or phone, or click the strip and press the left and right arrow keys.
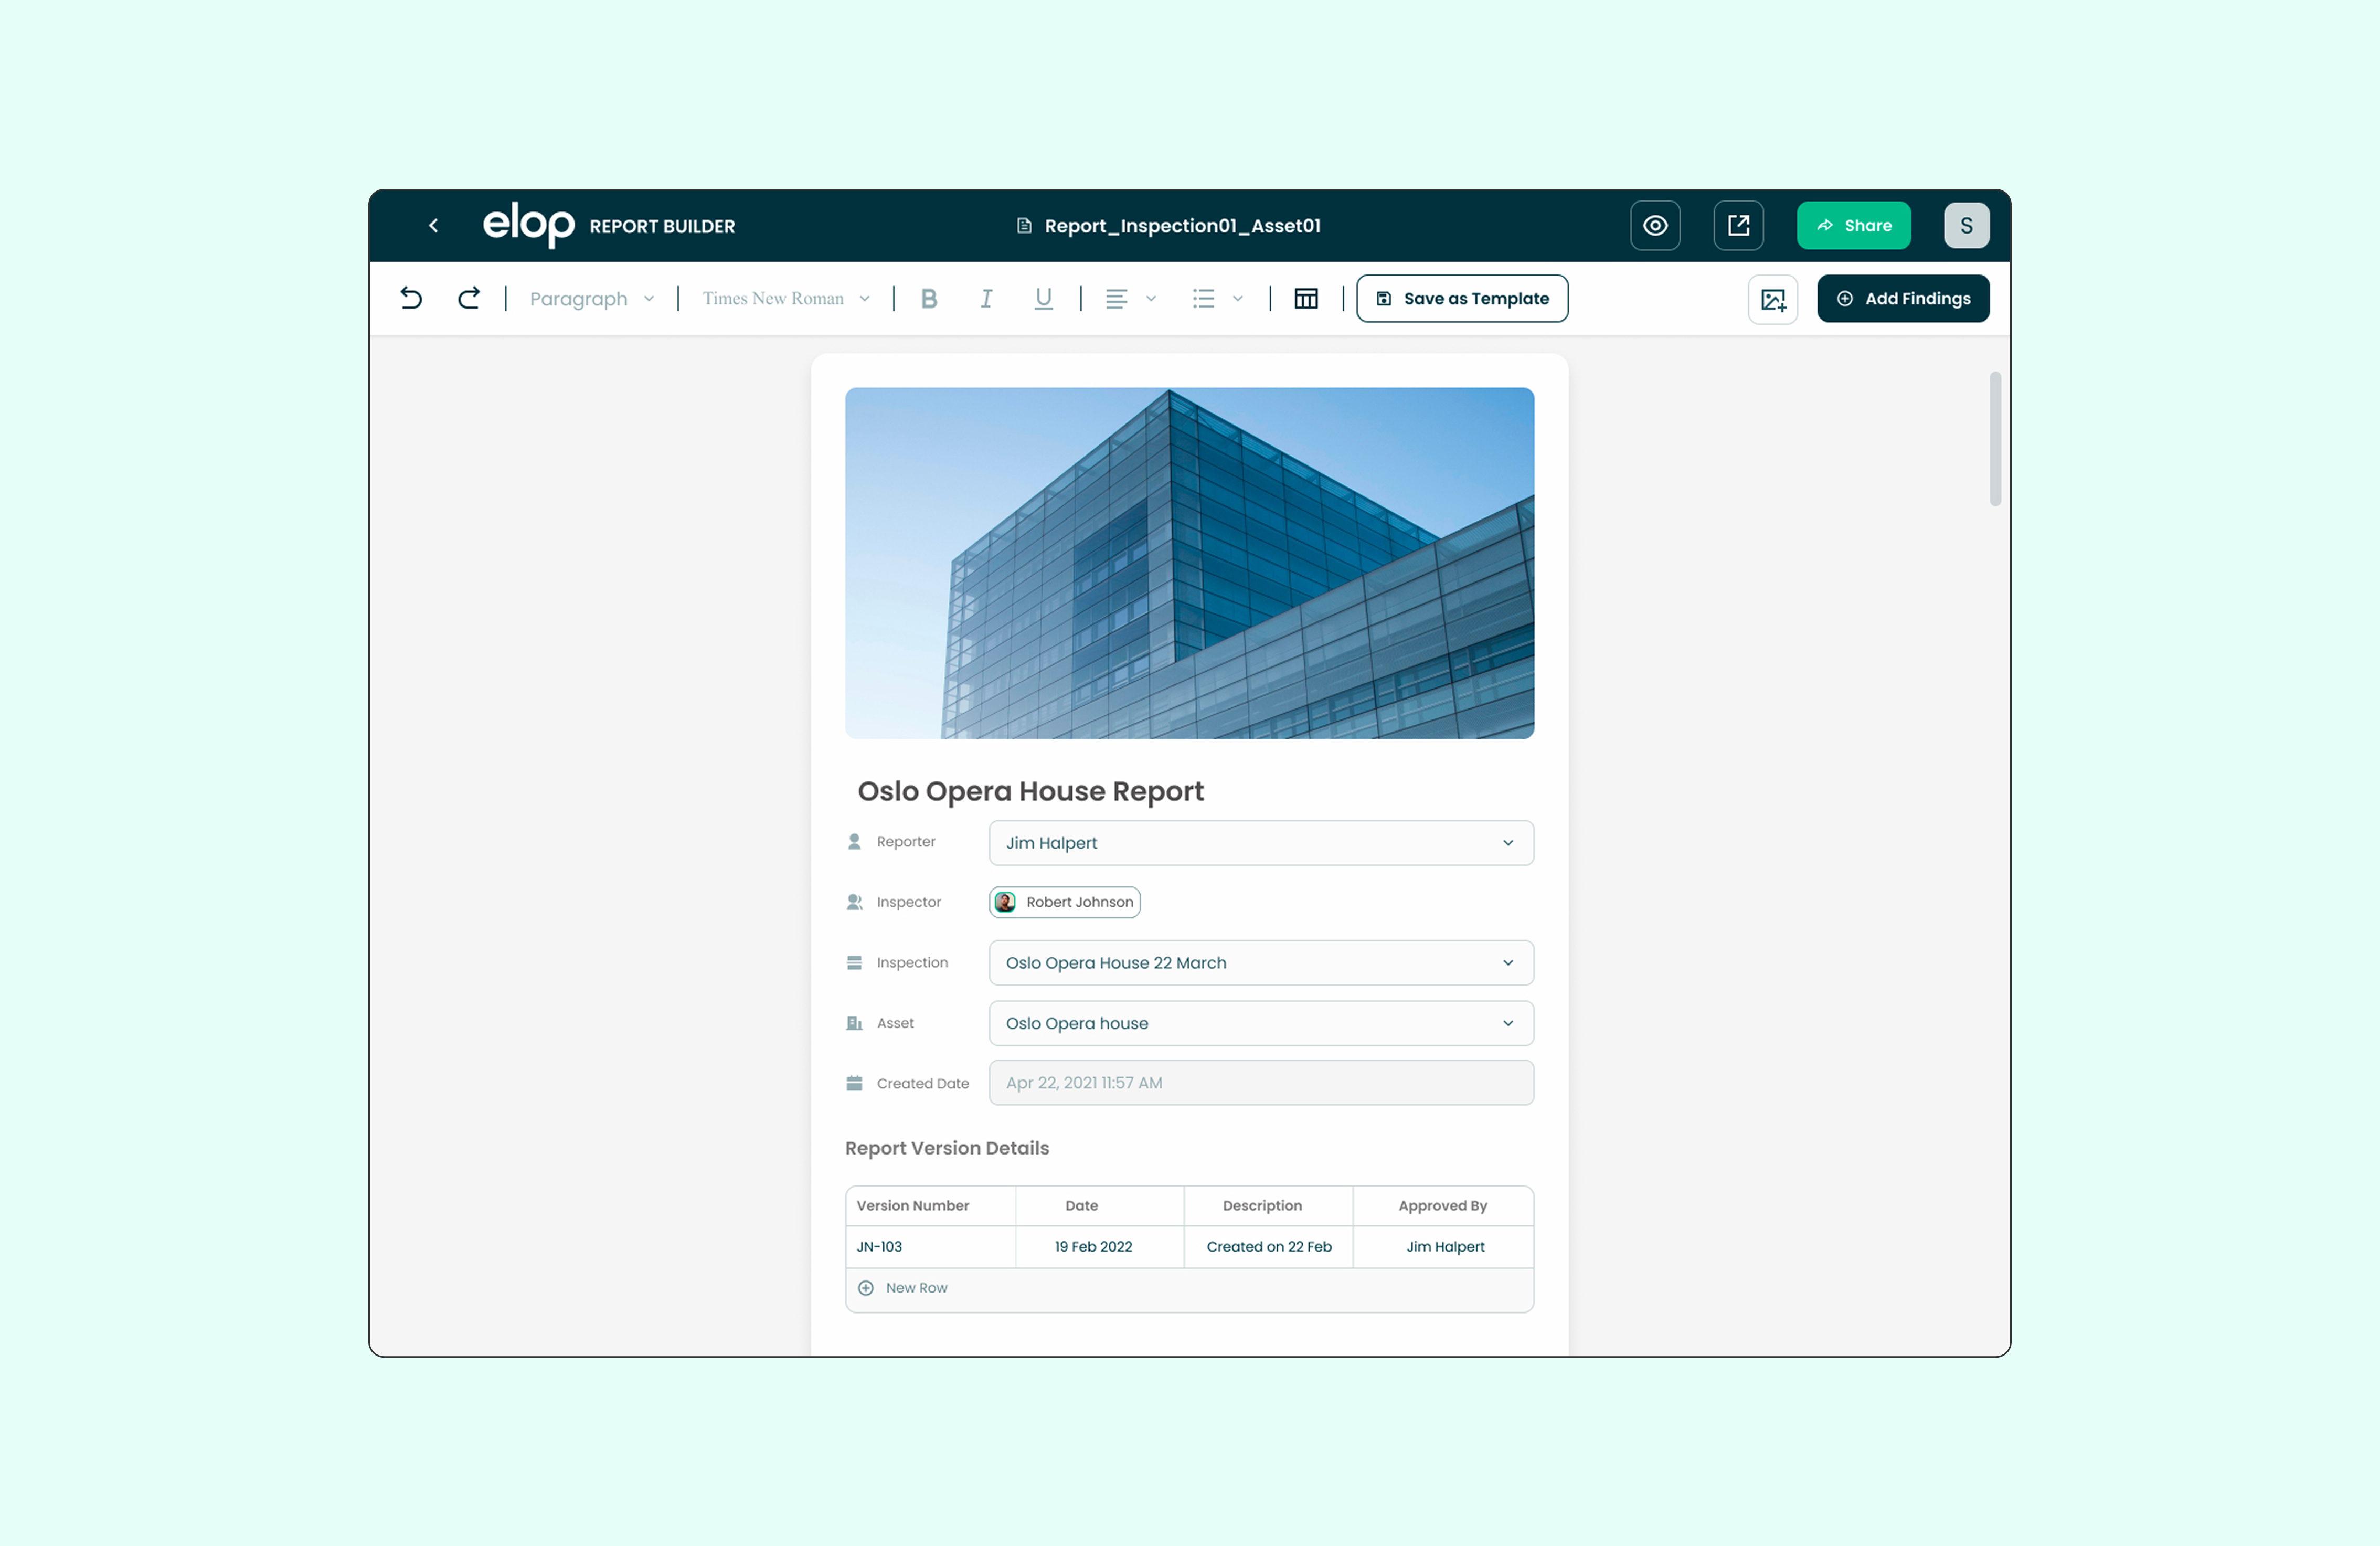
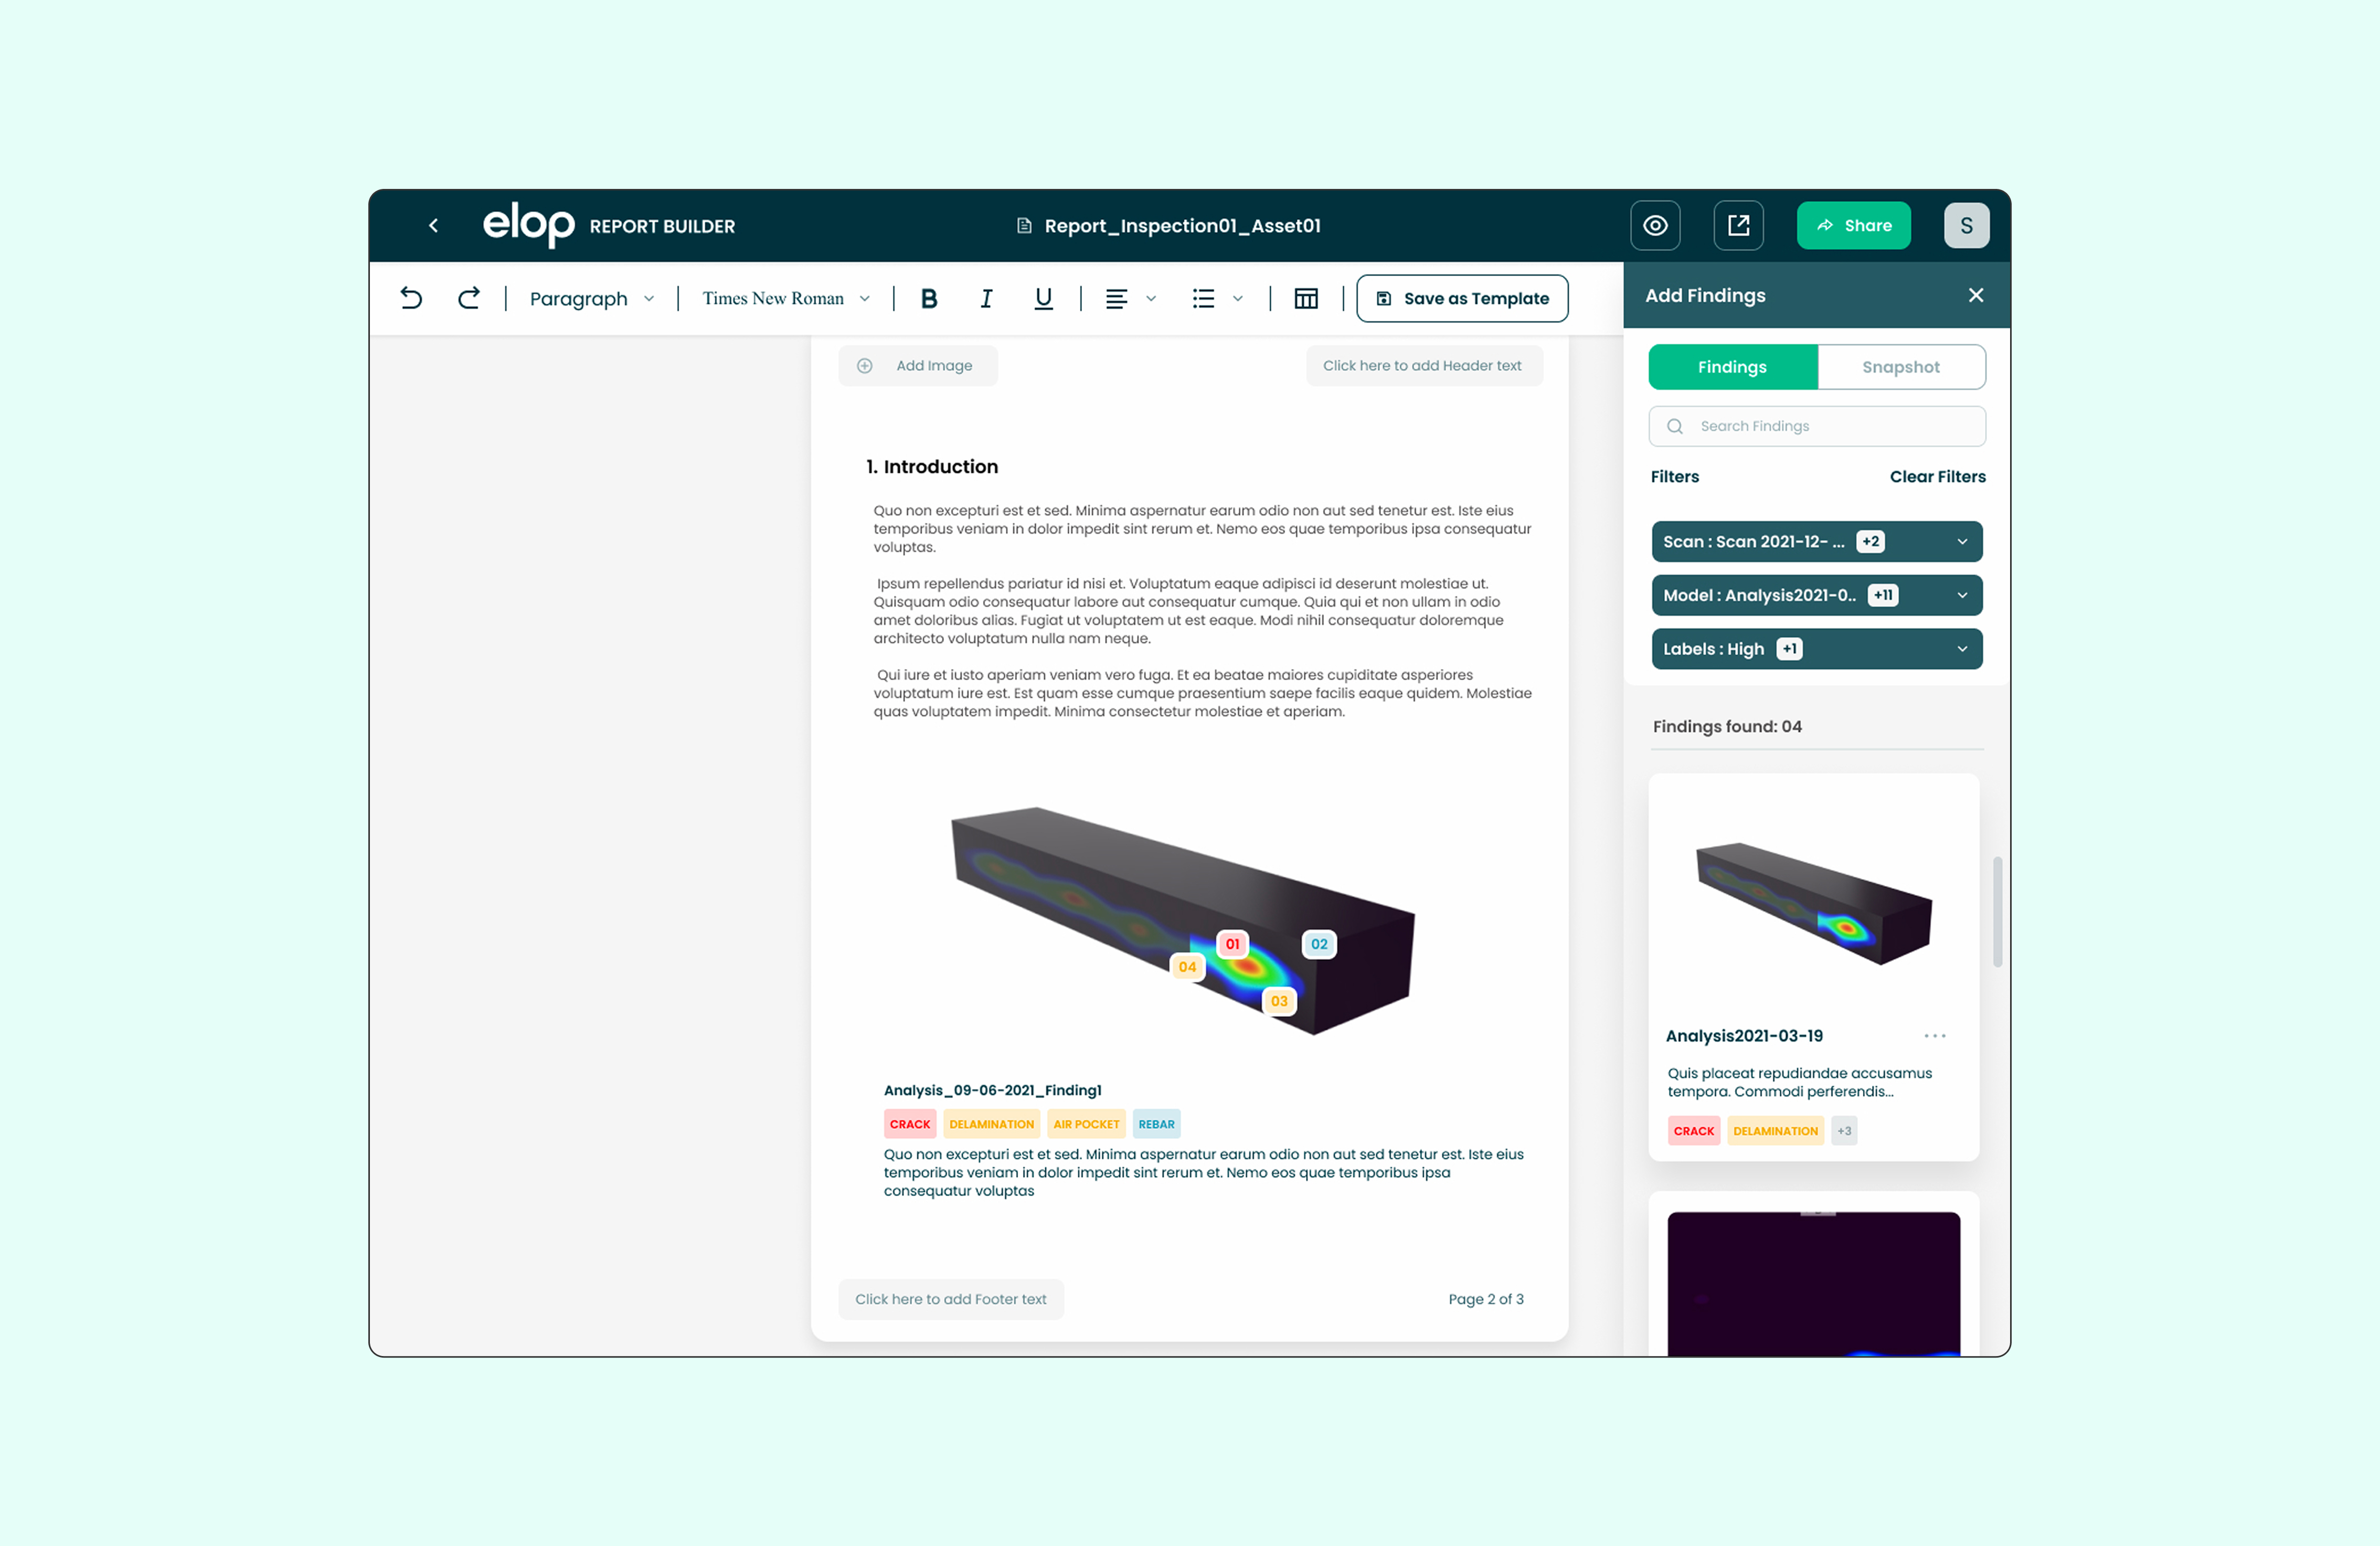
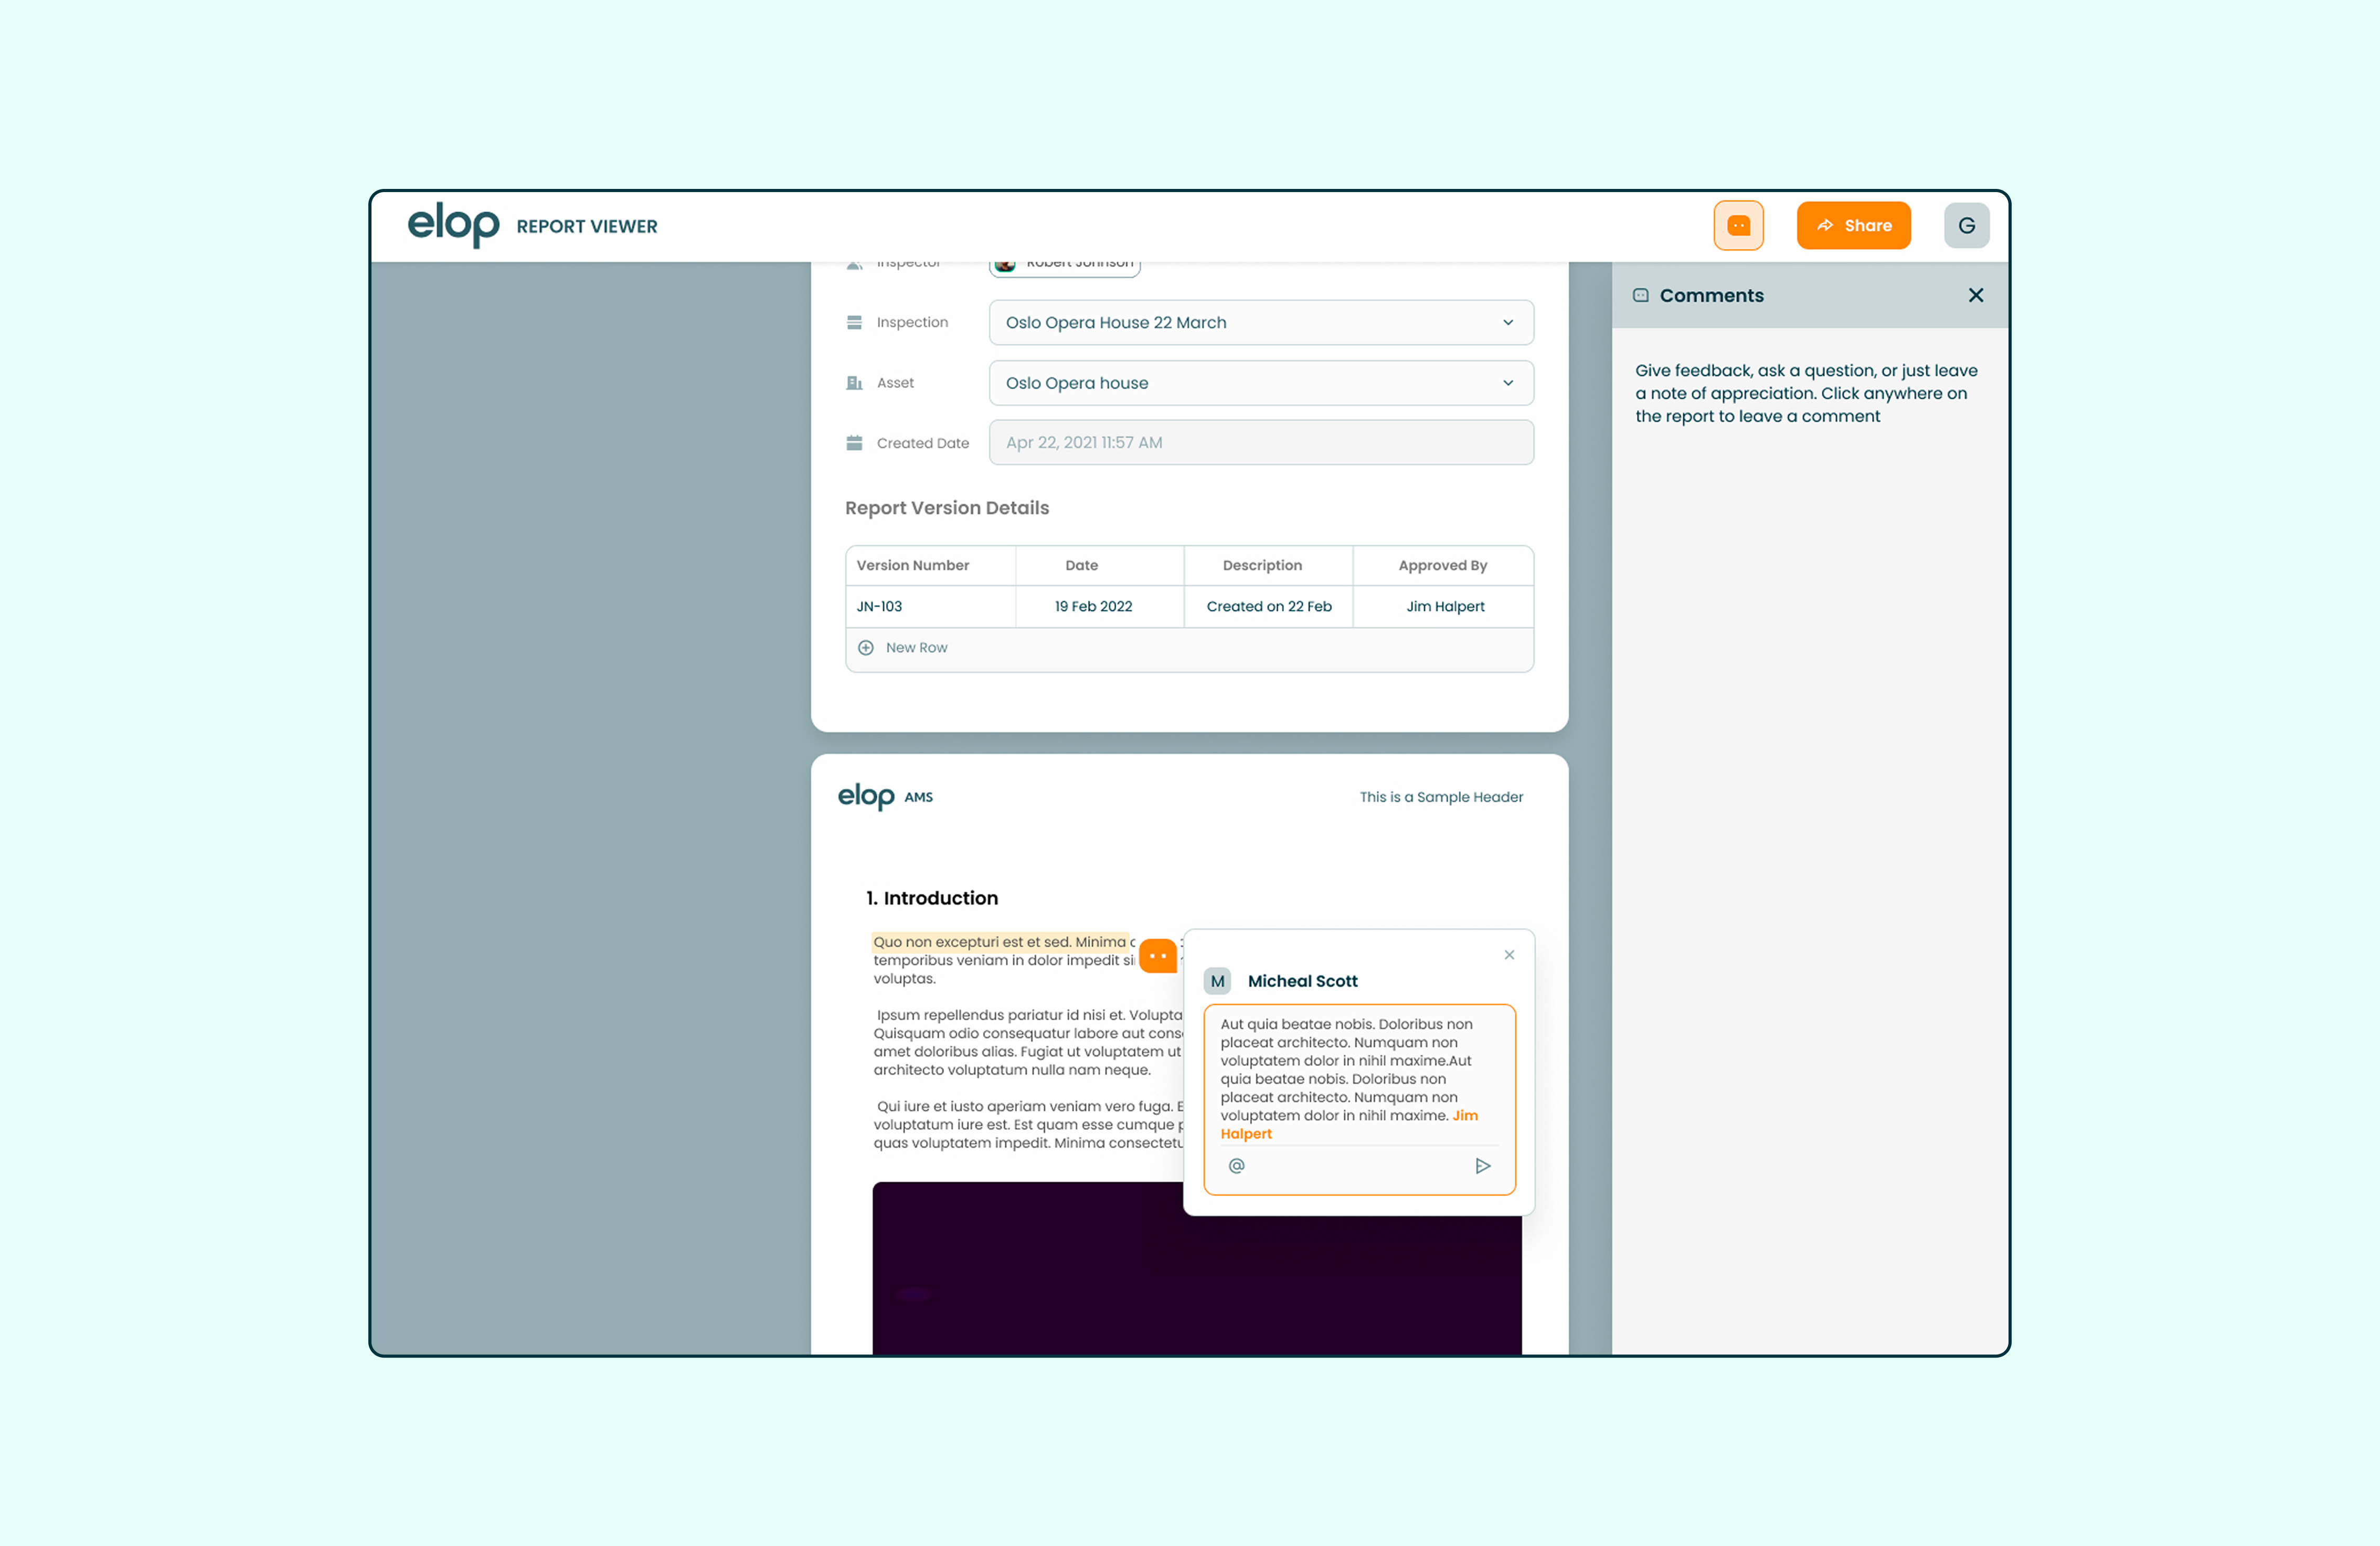
Before launch, we ran usability tests with the actual mix of users the tool was built for: asset managers, inspectors, and researchers. We tested three things. Navigation, whether people could find the core actions, like starting a new report, editing one, and adding content, without hunting for them. Efficiency, using a timeboxed method to track how long each task took and how many clicks it needed. And a direct comparison against Word and Google Docs, to see whether the new builder actually closed the familiarity gap it was designed to close.
The comparison against Word and Google Docs was the real bar. Once people could complete the same report-writing tasks at a similar speed to those tools, while getting the inspection data for free, the case for switching made itself.
Report turnaround fell from one to two weeks down to three days. Adoption grew 45% and spread past the original group of researchers to the wider team, and 65% of new reports are now built directly inside Insight rather than started in an external editor.